
by Tessa Hall, Alan Manning & Madeleine Sumption
This report examines how different types of immigration contribute to net migration in the long term and what levels of net migration the UK might expect in coming years.
Note: this analysis has been updated following the release of new official migration statistics in May 2024 and policy changes to student and worker visas.
1. Introduction
Net migration has been unusually high since 2021. The Office for National Statistics (ONS) estimates that net migration to the UK reached a peak of 764,000 in 2022, up from 184,000 in 2019 before the pandemic (ONS, May 2024).
High net migration figures have intensified debate over UK migration policy and the future outlook for migration. Politicians of both major parties have said that they think net migration is too high. The previous government introduced restrictions on work, study and family visas, which started to affect the number of visa grants in the first half of 2024.
ONS population projections assume that net migration will fall to 315,000 per year. The Office of Budget Responsibility (OBR) has applied the same assumption in its economic forecasts. How plausible is this projection? Is it likely that net migration will fall by as much as 59% over the next decade or so? This short report draws on analysis from the Migration Observatory and the Centre for Economic Performance at the London School of Economics to examine these questions.
Net migration in the UK is defined as the number of people who immigrate to the UK long term (for at least 12 months), minus the number who emigrate long term. But often, discussions of net migration overlook emigration, and specifically the fact that most migrants come to the UK for periods of only a few years, before emigrating again. This means that changes in immigration have more impact on net migration in the short run than the long run, in both directions.
- When immigration increases sharply, as it did in 2021-2023, this leads to much higher net migration. However, higher immigration means that emigration should eventually rise, too, causing net migration to fall even if the number of people immigrating to the UK remains high.
- When immigration decreases—as it may do in 2024 following new visa restrictions, this initially has a substantial impact on net migration. However, lower immigration means that emigration falls, too, pushing the net figure up again (though not as high, of course, as it would have been if immigration had remained high).
To illustrate this pattern, we present a ‘bottom-up’ approach used to project net migration from 2024 to 2032 based on a set of assumptions about levels of immigration and the share of migrants in each immigration category who subsequently leave the UK. Using past data on visa grants and expiries, we estimate the contribution of each type of migrant to overall net migration.
The analysis is not designed to be a confident prediction of future net migration. Forecasts are invariably wrong, and this one will be no different. Different assumptions will lead to different outcomes, and reasonable people will disagree about which set of assumptions is most plausible. Instead, we aim to illustrate some basic points about the dynamics of net migration during periods such as this one. In particular, the analysis suggests that:
- High immigration leads to high emigration, but not immediately – there is a lag of two to three years. Unless there is a large change in emigration behaviour from what we have observed in the past, it is reasonable to expect that emigration will increase in 2024, bringing down net migration. Of course, behaviour may change and this would make the projections in our model less accurate. Indeed, there is early evidence that more international students are remaining long-term after their studies.
- In our baseline scenario, net migration falls to 337,000 by 2032, roughly similar to pre-Brexit levels. This decline results from assumed decreases in work and study visa migration following the early 2024 policy changes. It is offset by falling emigration in subsequent years.
- There is a wide range of plausible scenarios for future net migration, however. The projection is sensitive to assumptions about future immigration levels and how long migrants will stay in the UK. That said, the conclusion that net migration is likely to fall from its 2022 peak holds true under a wide range of assumptions. Even if immigration for all categories remained at 2023 levels—including work visa holders, whose numbers have already declined sharply—projected net migration in the model still falls to around 500,000 due to rising emigration.
To examine the potential future trajectory for net migration, we need to make assumptions about future immigration, i.e. long-term arrivals (Section 2). We must then understand what share of migrants in different immigration categories are likely to emigrate (Section 3). We then examine what this means for future net migration (Section 4). In Section 5, we explore how our 2030 net migration projections change under different assumptions about future immigration levels and stay rates. And in Section 6 we describe various future net migration scenarios in the UK context.
2. What might future immigration look like?
Immigration into the UK can be broadly subdivided into different categories depending on people’s migration status. Key categories include immigration on visas for work, study, family or humanitarian reasons. Humanitarian reasons include refugee resettlement, the BNO and Ukraine visa schemes, and grants of asylum. In addition, some people migrate with free movement rights from before Brexit (EU citizens with pre/settled status under the EU Settlement Scheme); and British citizenship.
The future outlook for each category is uncertain. However, we can make assumptions about what immigration might look like for each group based on recent data. The assumptions are necessarily speculative. In practice, some will turn out to be too high and others too low.
The main model is based on the following assumptions (further detail can be found in Appendix A):
- Work migration declines following the ban on care workers’ dependants and the decrease in health and care main applicants that took place in the first half of 2024. For now, we do not assume a decrease in other skilled worker following the increase in the salary threshold from £26,200 to £37,800 as no decrease is yet visible in the (limited) available data.
- The government’s decision to restrict students’ ability to bring dependants reduces the number of both dependants (90% decrease) and main applicants (15% decrease).
- The Ukraine and BNO humanitarian visa categories decline somewhat in coming years, as there is some reason to believe they will not continue indefinitely. Both have started to taper off since the visa schemes first opened.
- Future asylum immigration continues at 75,000 per year, based on the 2021-2023 average level. Asylum-related migration is volatile and particularly difficult to forecast, however.
- Refugee resettlement continues at 2024 levels (4,000).
- Future immigration of people on family and other visas continues at the ONS’s estimated December 2023 level.
- Net migration of British citizens continues at roughly 2024 levels.
- Net migration of EU citizens who are not coming on visas under the post-Brexit immigration system (i.e., who have settled or pre-settled status under the EUSS) increases to zero over the next few years. That is, we assume that EU citizen net migration will not be negative forever and that EU citizens will start contributing to overall net migration due to their use of the new visa system.
Table 1 in Section 5 shows how our future net migration projection reacts to each assumption being changed within reasonable bounds. An LSE technical paper explains the model, although the assumptions in this version of the report have now been changed to reflect recent developments, as outlined in Appendix A.
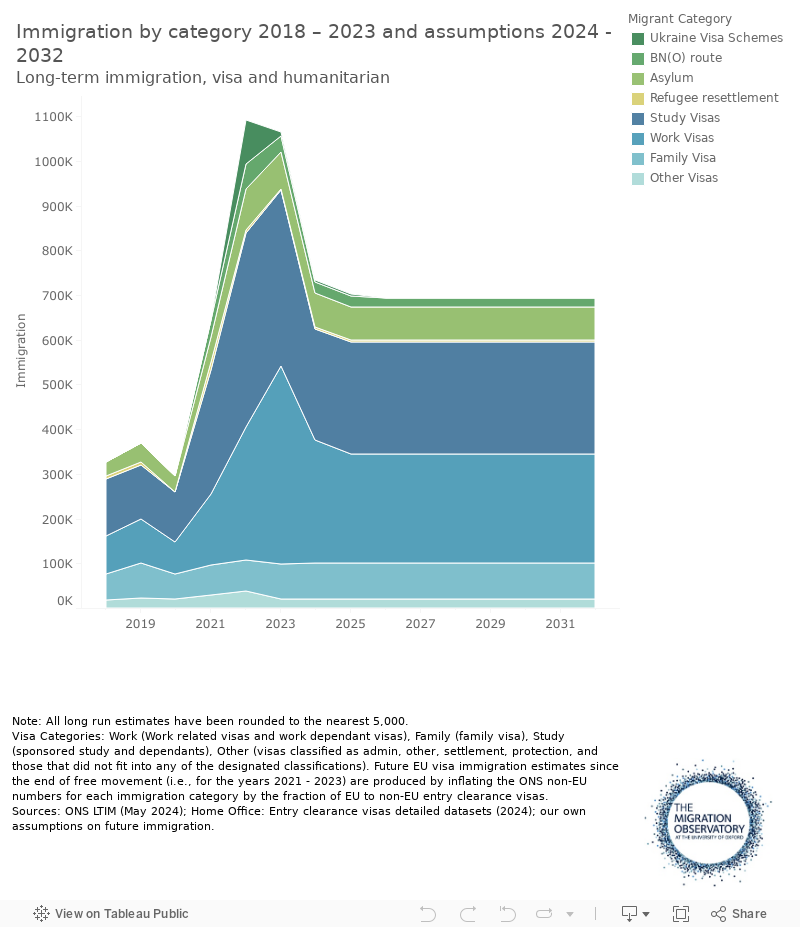
Figure 1 shows the overall effect of these choices on total assumed immigration from visa and humanitarian routes (i.e. excluding British citizens and EUSS status holders). We assume that long-term immigration from these categories will fall by 46% from 1,065,000 in 2023 to 774,000 from 2026 onwards. This is primarily due to fewer workers and students.
Figure 1
3. What might future emigration look like?
The main purpose of our model is to project future emigration (rather than immigration) and thus understand what may happen to net migration.
Every year, some migrants leave the UK. The likelihood of this happening will depend both on the reason for migration and how long the person has been in the UK. For example, international students are much more likely to leave than people coming to join British or settled family members. People who have been in the UK for a long time are more likely to stay permanently. In practice, Home Office Migrant Journey data suggest that most non-EU citizens who leave do so within 8 years.
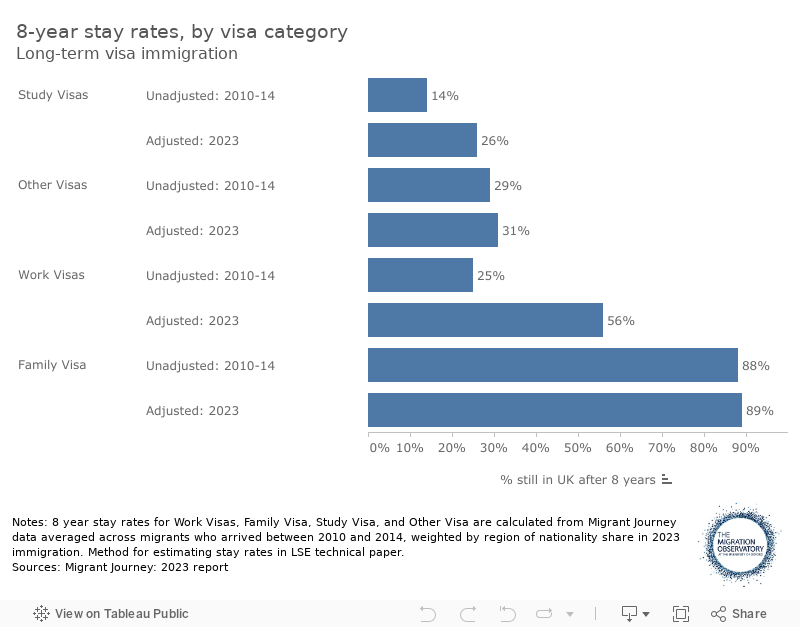
To project future net migration, we need assumptions about what share of migrants who arrive in a given year and in a given immigration category will leave in the subsequent years. These assumptions are based on previous ‘Migrant Journey’ data, which shows which migrants still have valid permission to remain in the UK at the end of each year after their initial visa grant. However we also make some adjustments where the Migrant Journey data on previous cohorts may not reflect current trends. Details of the assumptions we have made are in Appendix A. The main assumptions are as follows:
- We start with the ‘stay rates’ for migrants who arrived between 2010 and 2014. The likelihood of migrants staying in the UK varies by country of origin, however, and the countries which migrants are coming from has changed over time. We therefore reweight to account for the changing regions of origin.
- We adjust the work visa stay rate upwards substantially from past levels to account for the rising share of Skilled Worker route grants and the declining share of intracompany transfers.
We adjust the student stay rate upwards since Migrant Journey data shows that recent cohorts of students are more likely to stay in the UK.
Figure 2
Emigration depends on a combination of immigration levels and the rate at which migrants who have immigrated leave the UK over time, as the LSE technical paper describes in more detail.
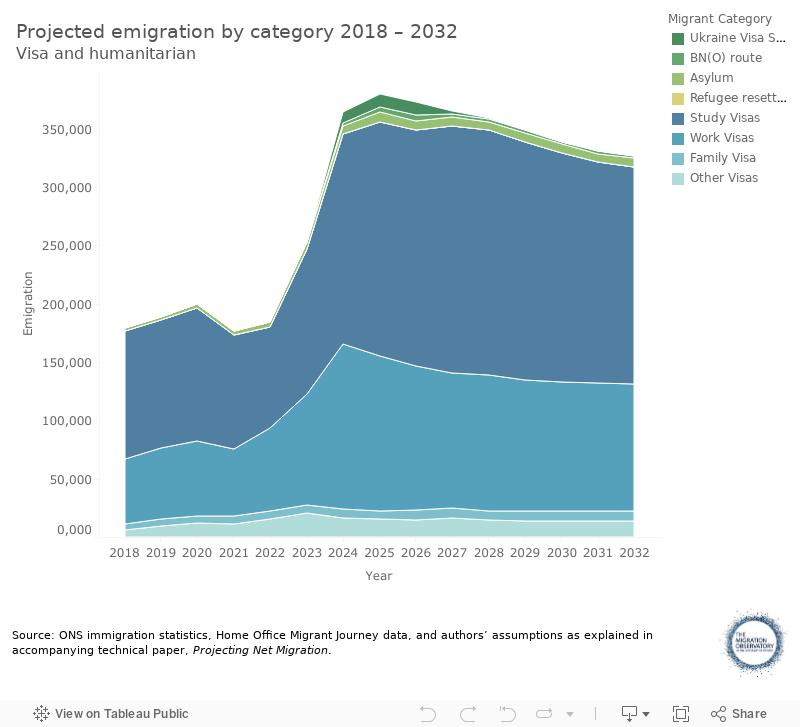
Because immigration levels increased between 2020 and 2023, the model projects that emigration levels will increase sharply, peaking in 2024 (Figure 3). The projected increase in emigration in 2024 results primarily from larger numbers of international students leaving the UK and an increase in emigration of work-visa holders.
After 2025, however, projected emigration starts to decline. This is because of the projected decrease in immigration following the policy changes discussed in the previous section.
Figure 3
Students play a large role in projected future emigration. However, it is important to note that trends in international student migration have changed enormously recently. More students have come to the UK from different countries than in the past. In January 2024, the government banned most students from bringing dependants to the UK. Students’ migration patterns are thus particularly difficult to predict, and it is possible that the timing or scale of emigration could differ from what we see in past data. If high shares of students remain in the UK than our model assumes, this would mean the spike in emigration expected in 2024 would be smaller.
4. What does this mean for future net migration?
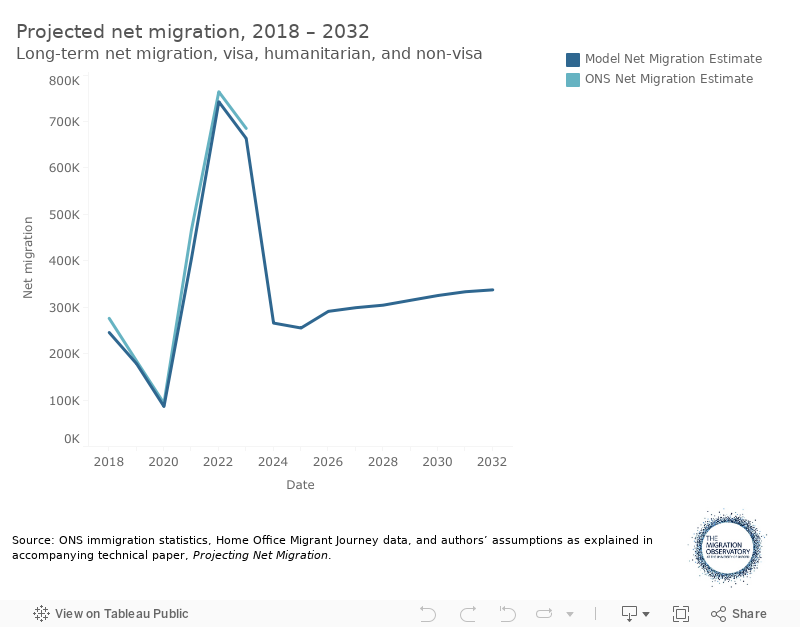
Subtracting projected emigration (Figure 3) from our assumed immigration levels (Figure 1) and adding the assumed net migration of British and EU citizens with pre/settled status gives a projection for overall net migration, shown in Figure 4.
These figures should not be used to predict what the next set of official net migration statistics will be. The precise timing of emigration and the levels of immigration will likely change. The purpose of this analysis is simply to illustrate a plausible scenario for the overall trend in coming years.
Figure 4
In the model, past immigration is taken directly from ONS estimates, but emigration is not—it is projected based on previous immigration flows and can thus differ from published ONS figures, which have a more complex methodology and use non-public information about entries and exits at the border (and not just visa grants and expiries).
Indeed, for 2022 and 2023, our model predicted higher emigration than ONS believes actually took place. As a result, our model also predicted lower net migration—665,000 for 2023, compared to 685,000 in the ONS estimate. This underlines the fact that the model is not expected to predict net migration precisely. While the model predicts that emigration increases substantially between 2022 and 2024, if the ONS figures are correct, it suggests that the increase in emigration was lower than the model anticipates.
With these caveats, the main scenario shows net migration initially falling rapidly, as immigration falls and emigration increases simultaneously, and then increasing slightly as emigration adjusts, to around 337,000 by 2032. There are many factors that could change this course, which are outlined more in the next sections of this report. The fact that emigration adjusts based on previous immigration means that the impact of the policy changes is much larger in the short run than the long run. The projected 326,000 decline in net migration from 2023 to 2032 now results exclusively from lower immigration.
5. Net migration in the longer run
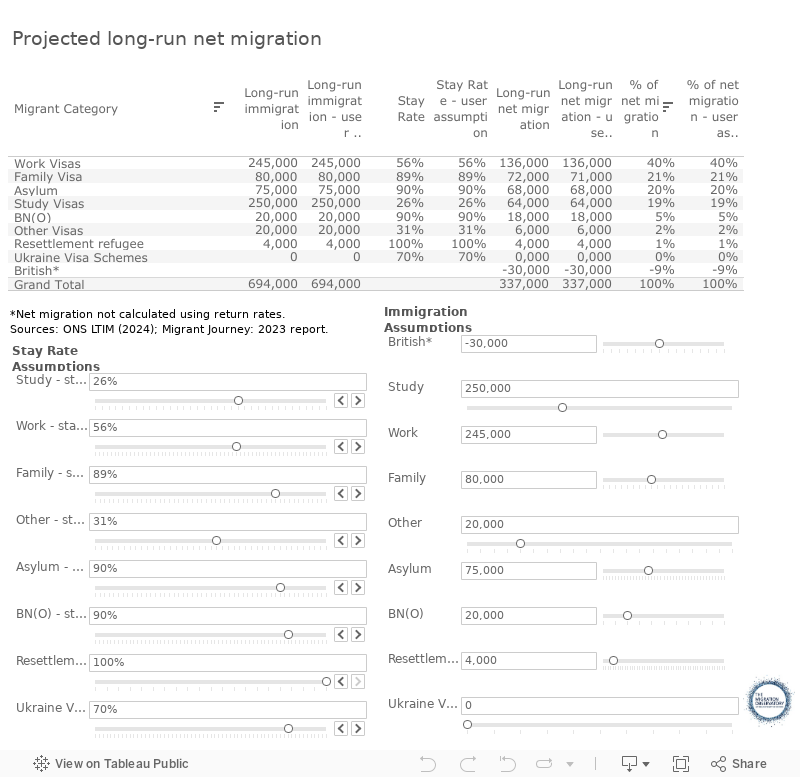
Using assumptions about the level of immigration and the rate of emigration, we can project long-run net migration in a ‘steady state’. This is the long-run emigration level in each category multiplied by the fraction of those who stay indefinitely. Table 1 shows how much different types of immigration contribute to long-term net migration, assuming that emigration rates remain roughly similar to what they have been in the past. Readers can adjust the assumptions in the table to see how long-run net migration might respond in different scenarios.
Future immigration could differ from our baseline assumptions for a variety of reasons. Some of these are explored in more detail in Section 6. These include the possibility of increased or reduced demand for overseas workers, changes in stay rates, and continued high levels of asylum migration.
Note also that the model uses official ONS immigration figures as an input, and these have been substantially revised over time. Any further revisions from ONS would change the data used in the model and, therefore, also the projections.
In our baseline scenario, people on work visas contribute the largest share of net migration in the long term. Students are also large contributors. Even though students’ stay rates are lower than any other group, the number of students is sufficiently large that a small share remaining permanently can make a meaningful contribution to long-term net migration. (Note that most students who remain in the UK long term do so by switching to skilled work visas, so work visa policy is likely to affect students’ stay rates more than student visa policy.)
Note that the long-run immigration estimates in Table 1 are lower than the number of visas issued. This is because some people do not take up their visas and others stay for less than a year and so are not considered long-term migrants in the official net migration estimates. Readers should not adjust the table using visa grant numbers as this will greatly overstate projected net migration. For guidance on plausible levels of immigration by reason for the main categories, readers can consult previous ONS estimates for non-EU citizens in Figure 2 of the May 2024 ONS publication.
Readers should also note that just because it is possible to use this tool to produce a long-run projection at a given level—high or low—does not mean that it is plausible or likely.
Table 1
6. Future net migration scenarios
Future net migration trends are highly uncertain. If immigration levels are different from the baseline scenario laid out above, or if stay rates change over time, this will affect long-run net migration—as Table 1 shows. Indeed, it is extremely likely that at least some of the trends projected in Table 1 will change substantially in future because immigration patterns tend to evolve over time. Below, we discuss some of the main uncertainties in more detail.
Changes to student stay rates: The Graduate Visa route, introduced in July 2021, allows international students to stay on in the UK for two years after they have graduated. This may increase student long-term stay rates if it enables students to find a job that allows them to stay in the UK, and hence it may increase net migration from this category. The availability of long-term visas for social care jobs may also affect student stay rates. In 2023, many students switched directly into care work, which is also exempt from the new £38,700 salary threshold introduced in April 2024. Due to high immigration in this category, long-term net migration is very sensitive to stay rates. An increase or decrease in the student stay rate of 5 percentage points changes our long-term net migration estimates by 12,500.
Decline in student numbers: Government restrictions on the ability of international students to bring dependants, which came into effect in January 2024, could cause a fall in student immigration. This stems from the mechanical effect on student dependants as well as a potential fall in student numbers themselves, as studying in the UK becomes less appealing. We have assumed a 15% fall in student main applicants, although the actual decline could be larger than this. A further fall in long-term immigration of people on student visas (including dependants) of 50,000 with no change in the return rate would reduce the long-term steady-state projection for net migration by 13,000.
Changes to worker immigration: In 2023, worker immigration had risen from 2022 levels, driven by larger numbers of health and care workers. Visa restrictions were introduced in early 2024. In addition, the government released an NHS workforce plan in 2023, which aimed to reduce reliance on overseas recruitment of doctors and nurses in the medium term. It is very difficult to predict the impact of this package of changes. While it is reasonable to assume that they will reduce work immigration (including work dependants, who are included with workers in the ONS figures), in medium to long-term care, work migration could remain substantial if the government continues to take no action on care worker pay. We’ve assumed a decrease in worker immigration to 245,000 in 2024. If instead we assume that worker immigration continues at 2023 levels of roughly 445,000, this would increase our long-term net migration estimate by 112,000.
Higher worker stay rates: Future migrant worker stay rates might be higher than those observed in the past, even after adjusting for the country of origin of migrants and the rising share of skilled worker visa grants. One reason is the change in settlement policy, so that people no longer need to meet the settlement salary threshold, which was introduced in April 2011. Also, immigration has been rising rapidly for health and care workers. This group is more likely to bring dependants and thus may be more settled in the UK. We know from the Migrant Journey data that dependants (and hence also the main applicants they come with) have higher stay rates. A worker stay rate of 70% would mean an increase in our long-term net migration projection by 34,000.
Even if we assume no decline in immigration from 2023 onwards, projected net migration still declines due to increases in emigration. The scenario of no decline in immigration is not particularly plausible since it assumes the ban on student and care worker family members has no impact, and it ignores the fact that some categories, such as health and care migration, have already fallen sharply in the first half of 2024. Nonetheless, by way of illustration, if we hold all immigration categories at their 2023 levels, the model projects net migration declining to 506,000 in the long term.
7. Conclusion
There is a wide range of plausible trajectories for future net migration, making the precise future level extremely difficult to predict. But although the future is uncertain, there is good reason to believe that net migration will fall over the next few years—assuming there is no new major shock that affects immigration to the UK (as the Ukraine war did in 2022, for example). Even if we assume that immigration continues at its recent historically high levels, a higher immigration level should cause emigration to rise, offsetting the long-run impact on net migration.
The model presented in this report suggests that the largest category affecting the projected level of net migration in the coming years is the work route. In our central scenario, work-related migration (including dependants) accounts for 40% of net migration in the long term. Work migration has increased sharply, largely driven by the health and care sector (including the opening of the care worker route). We assume that future work migration will fall, and our net migration estimates are highly dependent on the extent of this fall.
Even though most students eventually leave the UK, they still make a meaningful contribution to net migration (19% of net migration in the long-run model).
Of the categories in our model, work and study are the ones that are most amenable to policy changes. Policymakers interested in shaping net migration levels in either direction are thus likely to find more impact in these categories. Indeed, work-visa policy is likely to be the main factor affecting the contribution of both work and study to long-term net migration since students usually need to switch to work visas in order to remain in the UK permanently.
Before Brexit, projections suggested that migration levels would fall due to the post-Brexit policy regime’s restrictions on EU migration. While the future outlook is necessarily uncertain, our model suggests that the current post-Brexit immigration system will not necessarily lead to lower net migration than the figures of roughly 250,000 to 350,000 seen in the mid-2010s. The main reason for this is the increases in non-EU work and study migration.
Finally, many factors could throw off the projections presented here, of course. For example, the model is based on the assumption that past patterns of behaviour will be a reasonable guide to the future. However, if stay rates—particularly of students or workers—change significantly beyond what we already assume will result from the changing nationality profile, this would affect overall net migration. Perhaps most importantly, the number of people arriving in the country is very difficult to forecast. This uncertainty underlines why it is difficult for the government to commit to delivering a specific level of net migration, even though it controls the visa system.
Acknowledgements
Thanks to everyone who gave comments on this analysis, especially Carlos Vargas Silva and Georgina Sturge. All errors are the authors’ own.
Appendix A: Assumptions
In this version of the report (September 2024) the main model assumptions have been calculated as follows.
| Type of migration | Assumptions |
|---|---|
| Work visa migration | We assume the work visa migration in 2023 was 443,000 after including EU citizens. We assume ‘worker’ visas (health & care, skilled workers and global business mobility) makes up 88% of work visa LTIM, equivalent to the share of Migrant Journey visas still valid at the end of the initial arrival year, in 2023. We assume Health & care visas make up the same share of worker visa LTIM as they do of worker visa grants, and the same applies to the breakdown by occupation and dependants/main applicants. We assume work visa migration declines following the ban on care workers’ dependants. We assume that no further care worker dependants arrive from 2025 onwards. We assume care worker main applicants fall by 74%, in line with the change seen between Q1 2023 and Q1 2024 in health and care main applicants. We assume that other health and care visas (excluding care), fall by 28%, in line with the change seen between Q1 2023 and Q1 2024. For now, we assume other skilled worker migration does not change despite the salary thresholds but remains at 2023 levels. This is because skilled worker visa grants in May and June 2024 did not decline. The result is estimated immigration of 245,000 workers in 2025, a 45% decrease from 2023. For 2024 only, we also include additional 30,000 care worker dependants who are still eligible to join main applicants who received their visas before the policy change in March 2024. |
| Student visas | We assume student dependant numbers fall by 90% in 2024. In practice the decrease may be higher. The number of student dependants fell by 80% from Q1-2 2023 to Q1-2 2024, although this will reflect some dependants continuing to arrive to join people who received student visas before the dependant ban was introduced. We assume a 15% decrease in student main applicants, in line with the 17% decline seen between the first 6 month periods of 2023 and 2024. |
| BNO and Ukraine | The number of BNO visas issued has been declining since the route first opened on 31 January 2021, from 29,311 in Q2 2021 to 7,393 in Q1 2024. In our projections we assume that BNO and Ukrainian visas issued will continue to decline in future. |
| Ukraine | ONS estimated that Ukraine scheme LTIM was less than half of the number of visa grants in 2022, and less than one quarter of visa grants in 2023. We assume that in 2024 and 2025, Ukraine LTIM falls by the same percentage that average quarterly visa grants have fallen between 2023 and Q1 2024. This gives Ukraine schemes LTIM of 5,000 in 2024. We assume zero Ukraine schemes migration from 2026 onwards. |
| BNO | For 2024 and 2025, we take the projected figure from the Home Office impact assessment of the BNO scheme central estimate, which is close to recent levels. We assume the number tapers down to 20,000 from 2026 onwards. |
| Asylum | Future asylum immigration continues at 75,000 per year, based on the 2021-2023 average level. This implicitly assumes that the government will not succeed in its aim to reduce asylum arrivals. |
| British citizens | Net migration continues at roughly 2024 levels (40,000). This may be an underestimate, since ONS analysis has found that British net emigration exceeded 50,000 between the Census years in the 2010s. |
| Category | Stay rate assumptions |
|---|---|
| All | We use Migrant Journey data for migrants who arrived between 2010 and 2014, for which we can observe their visa status up to 8 years after entry to the UK. Our model assumes that migrants who have been in the UK for longer than 8 years will stay indefinitely. |
| Cohort adjustment | A separate stay rate is calculated for each visa category and year of arrival cohort. These are adjusted to account for the changing characteristics of migrants in each cohort, including the rising share of Skilled Worker route grants and the declining share of intracompany transfers and change in the countries which migrants are coming from. For the stay rate of future arrival cohorts, we use the most recent adjusted stay rates (2023). |
| Region of origin adjustment | Our region-of-origin adjustment leads to higher stay rates in our projection, as a greater number of migrants in 2023 originated from countries with high stay rates than in the past (Figure 2). The region-of-origin adjustment also addresses the increasing number of dependants per main applicant over time. More dependants generally mean higher migrant stay rates. So, the stay rates calculated using the 2023 ratio of dependants to main applicants will be higher than they have been historically. This is accounted for in the region-of-origin adjustment. In fact, even if we further adjust stay rates to account for the ratio of dependents to main applicants, the impact on estimated stay rates is not significantly different from those calculated using country mix adjustment alone. |
| Humanitarian visas | Data on stay rates are not yet available for BNO and Ukrainian refugees, because these routes are new. We assume the majority (90%) of BNO migrants will remain in the UK after 8 years. Ukrainians currently have 3-year visas and the government has not said whether it will extend these visas in future. Some Ukrainians may prefer to stay in the UK if the option is available. We assume an 8-year stay rate of 70%, which we recognise is necessarily arbitrary. |
| Asylum seekers | For asylum seekers, we assume a stay rate of 90%, based on the fact that most currently receive refugee status and in recent years removals of refused asylum seekers have been low. We assume that all resettled refugees remain in the UK indefinitely. |
| Students | For each cohort of arrival (2010 – 2023), we used the conditional stay rate for the years after arrival 1 – 8 from the most recent available years of MJ data (2023 report). For example, for the 2022 arrival cohort (and all subsequent years) used the % of the cohort that left the UK after 1 year from the 2021 arrival cohort, the % of the remaining that left after 2 years from the 2020 arrival cohort, etc. |
Note on changes made to this report
August 2024:
- Updated immigration figures and ONS net migration comparison (YE Dec 2018 – YE Dec 2022) with November 2023 ONS estimates.
- Adjusted student stay rates in central scenario upwards (LT stay rate changed from 18% to 26%).
- Updated immigration figures and ONS net migration comparisons using May 2024 ONS estimates (YE Dec 2018 – YE Dec 2023).
- Updated stay rate estimates using the 2023 Migrant Journey report.
- Changed future immigration assumptions based on data for the first half of 2024.
Data sources
- Home Office: Asylum and resettlement datasets (2024): Asy_D01: Asylum applications raised ; Asy_D02: Outcomes of asylum applications at initial decision, and refugees resettled in the UK
- Home Office: Entry clearance visa applications and outcomes (2024): Vis_D02 Outcomes of applications for entry clearance visas
- Home Office (2020): Fifth report on statistics relating to exit checks: 2019/20
- Migrant Journey: 2023 report: MJ_D01 End-of-year category and immigration status of all applicants issued leave by year of initial grant, category of initial visa, and country of nationality
- ONS LTIM (2024): Long-term international migration, provisional: year ending December 2023
- ONS LTIM IPS estimates (Aug 2020): Provisional long-term international migration estimates (Discontinued after August 2020)
- ONS Methods (2023): Methods to produce provisional long-term international migration estimates