
Note: this analysis was updated on 23/05/2023 to add visa data for calendar year 2022
This briefing note examines why there has been an increase in non-EU migration to the UK and what we can expect over the coming years. It concludes that:
- Three factors have come together to make the number of visas granted to non-EU citizens unusually high: the introduction of visa routes for Ukrainian refugees and Hong Kong British Nationals (Overseas) status holders, an increase in international student numbers, and an increase in skilled work visa grants, particularly in the health and care sector.
- High levels of non-EU visa grants cannot be assumed to be a ‘new normal’. The future outlook for visa grants is always uncertain. However, some of the recent contributors to non-EU immigration are not expected to continue indefinitely, such as the arrival of Ukrainian refugees.
- Higher immigration usually leads to higher emigration because most non-EU citizens on work and study eventually leave the UK. But the expected emigration typically takes 1-3 years to materialise. This means that estimates of net migration may be unusually high over the next couple of years before emigration catches up.
- Recent immigration patterns are not simply the result of the end of free movement and the introduction of the post-Brexit immigration policy. The Ukraine visa schemes were not part of the policy for replacing free movement, for example. The post-Brexit system is likely to have had some impact on non-EU visa grants, however, for example, via the extension of work visas to care workers and seasonal workers and the decision to grant international students post-study work rights.
Introduction
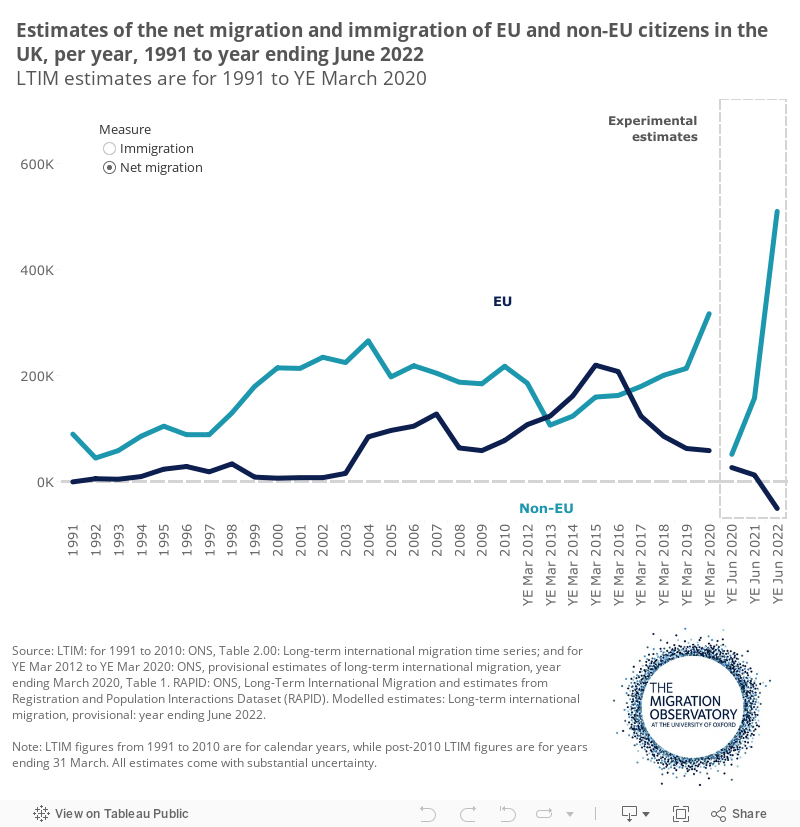
Over the past few years, a large shift in the countries of origin of migrants to the UK has taken place. In the mid-2010s, around the time of the Brexit referendum, the Office for National Statistics’ (ONS) main data releases suggested that EU citizens made up more than half of total net migration of non-UK citizens (Figure 1 – labelled as ‘LTIM’). Experimental figures using administrative data sources (labelled as RAPID in Figure 1) put the share even higher, at around three quarters.
Since that time, however, the picture has changed a lot. EU net migration fell sharply after the referendum, while non-EU net migration increased. The result is that in the most recent ONS estimates, which cover the year ending June 2022, EU citizens made no contribution to net migration at all. Indeed, net migration of EU citizens was slightly negative.
All else equal, this decline in EU migration would be expected to lead to lower overall migration, and this is what modelling conducted before the introduction of the new immigration system consistently predicted. But all else was not equal. Instead, there has been a significant increase in immigration and net migration from non-EU countries.
Figure 1
Immigration statistics have been disrupted by a combination of the Covid-19 pandemic and the transition from one set of methods for measuring migration to another. As a result, migration figures are currently very uncertain, and the estimates that have been published so far are likely to be revised in future.
Nonetheless, different data sources consistently show an increase in non-EU migration to the UK since the mid-2010s, interrupted only briefly by the pandemic. In the year ending March 2020, before the pandemic, different estimates put non-EU net migration at 230,000 to 316,000. After a sharp fall during the first lockdown, the most recent estimate of non-EU net migration was around 509,000 for the year ending June 2022.
Which types of non-EU migration have driven the overall increase?
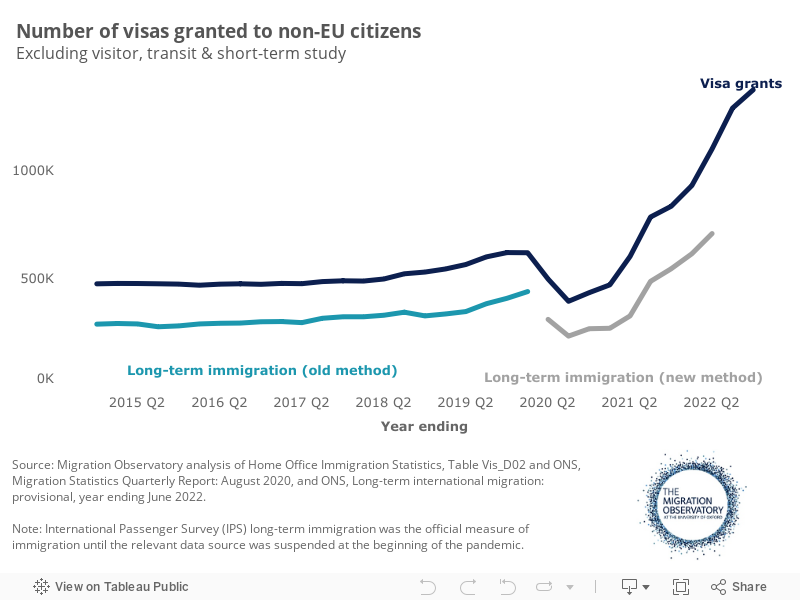
Visa grants data give more detail on which legal channels bring non-EU citizens to the UK. Visa grants to non-EU citizens are higher than official immigration estimates because some people granted visas never arrive, and others come only for short periods and so are not counted as long-term migrants (Figure 2). For example, seasonal worker visas last for six months and so are expected to contribute to visa grant numbers but not to long-term immigration.
Figure 2
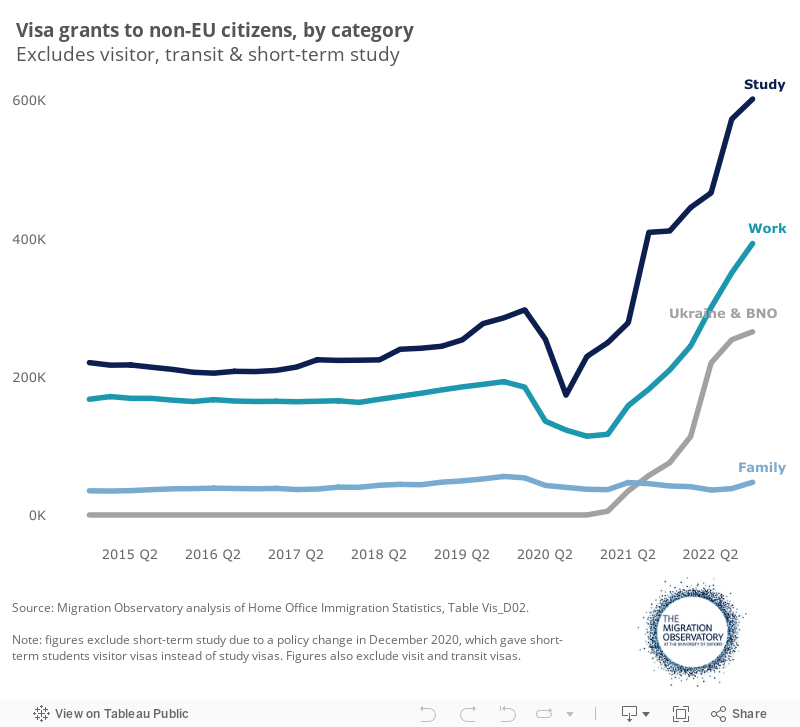
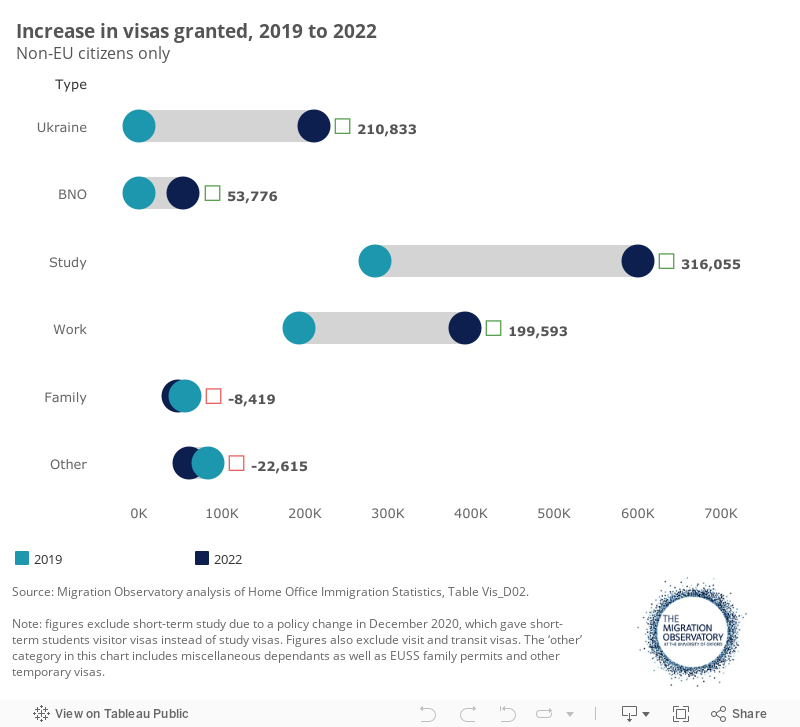
When we break down non-EU visa grants into different categories, it becomes clear that there is no single factor driving the overall trend. Increases take place in three main categories: work, study, and the ‘bespoke humanitarian routes’ for people leaving Ukraine and Hong Kong (Figure 3).
Figure 3
International students
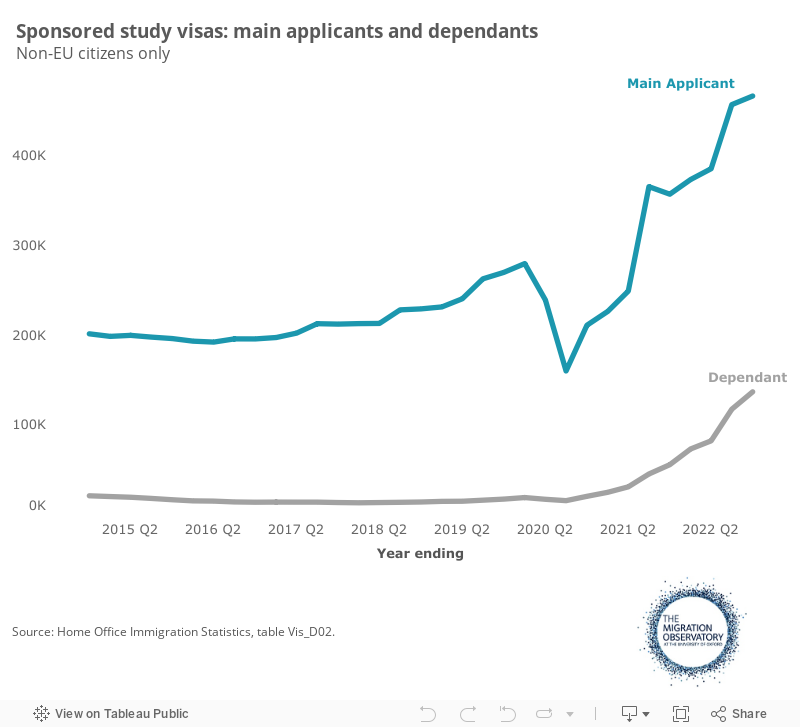
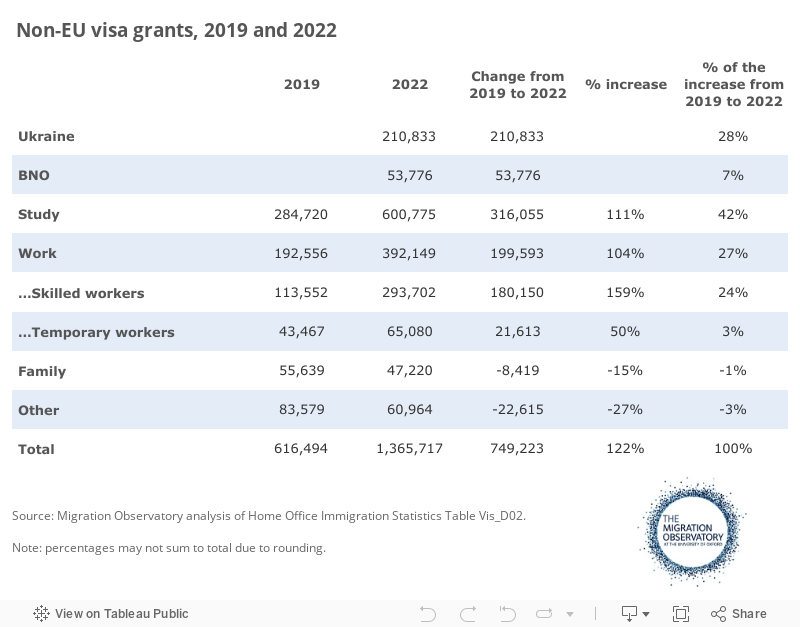
The largest driver of the overall increase in visa grants was sponsored students and their family members, who made up 316,000 or 42% of the total increase in visa grants from 2019 to 2022. (The calculation excludes short-term students, who received larger numbers of visas in 2019 but are now included within the ‘visitor’ category.)
The reasons for the sharp increase in the number of international students coming to the UK remain uncertain. It is likely that the reintroduction of a post-study work visa (known as the Graduate route) post-Brexit has made the UK more attractive to international students, although it is difficult to know how much of the increase results from this policy change. The government has also had an explicit strategy of increasing international student recruitment to the UK and diversifying the countries from which students are recruited. India and Nigeria, the two countries that saw the largest increases in the number of student visa grants, were named among the immediate ‘priority countries’ in the government’s strategy. Some of the increase in student numbers may also be a bounce-back from the pandemic when some students who had started a UK course studied remotely and did not require a visa until they joined in person.
There has also been an increase in family members of students. Of the total 316,000 increase in student visas issued to non-EU citizens, 62% was from main applicants, and 38% was from their partners or children receiving student-dependant visas.
The Migration Observatory briefing, Student Migration to the UK, provides more background on student migration.
Figure 4
Ukraine and BNO schemes
The largest increase in the number of visas granted comes from the two main visa routes that the government opened in 2021-2 for people leaving Ukraine and Hong Kong. In 2022 there were just under 54,000 grants of Hong Kong British Nationals Overseas (BNO) visas and 211,000 under the Ukraine Family and Sponsorship schemes. Together, these two categories made up 19% of all visa grants to non-EU citizens in 2022. They accounted for 35% of the 749,000 increase in visa grants since 2019 when the two schemes in question did not yet exist. The Ukraine schemes accounted for 28% of the increase, and the Hong Kong BNO scheme for 7% (Appendix Table 1 and Figure 5).
Figure 5
Work visas
Finally, work visas contributed 200,000 or 27% of the total increase in visa grants from 2019 to 2022. Here, the growth was driven by skilled workers: an increase of 180,000 or 24%, of the total rise in visa grants since 2019. (Note that figures on each category’s percentage contribution to the total increase in visas issued will sum to 100%, but some combinations of categories will sum to more than 100% because other categories have declined since 2019.)
The largest driver of skilled worker grants has been high demand in the health and care sector. From the year ending June 2019 to the year ending December 2022, the number of main applicants for skilled work visas in the health and social care sector increased by just under 60,000 (this excludes accompanying family members) (Figure 6).
Figure 6
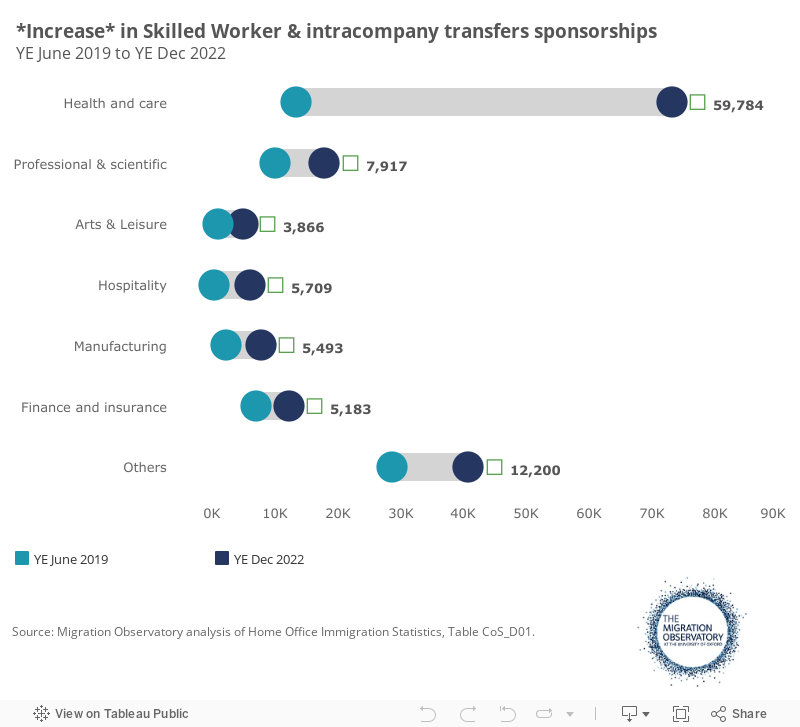
In February 2022, the government made care workers eligible for skilled work visas, following a recommendation by the Migration Advisory Committee. Provisional Home Office statistics suggest that around 57,000 visas were granted to care workers in 2022, indicating high take-up of this new visa option. Another factor behind higher numbers of health and care visas issued is that the NHS has increased staffing, particularly among nurses. The number of full-time equivalent nurses working in NHS hospital and community health settings, for example, increased by more than 30,000 from July 2019 to July 2022.
Is this a ‘new normal’ or a temporary trend?
The high level of visa grants in the past year result from a combination of three entirely separate trends: the humanitarian routes introduced for Ukrainians and Hong Kong BNOs; student visa increases; and growth in demand for skilled work visas, particularly in the health and care sector.
Although these increases took place shortly after Brexit, they are not all the direct result of the post-Brexit immigration system or the end of free movement. The Ukraine and BNO schemes together contributed a substantial share of the increase in visa grants and were not part of the system designed to replace free movement, for example.
Forecasting the numbers in coming years is difficult, but there are reasons to believe that at least some of the increases seen in recent years will be temporary, while others may persist for longer.
Ukraine and BNO schemes
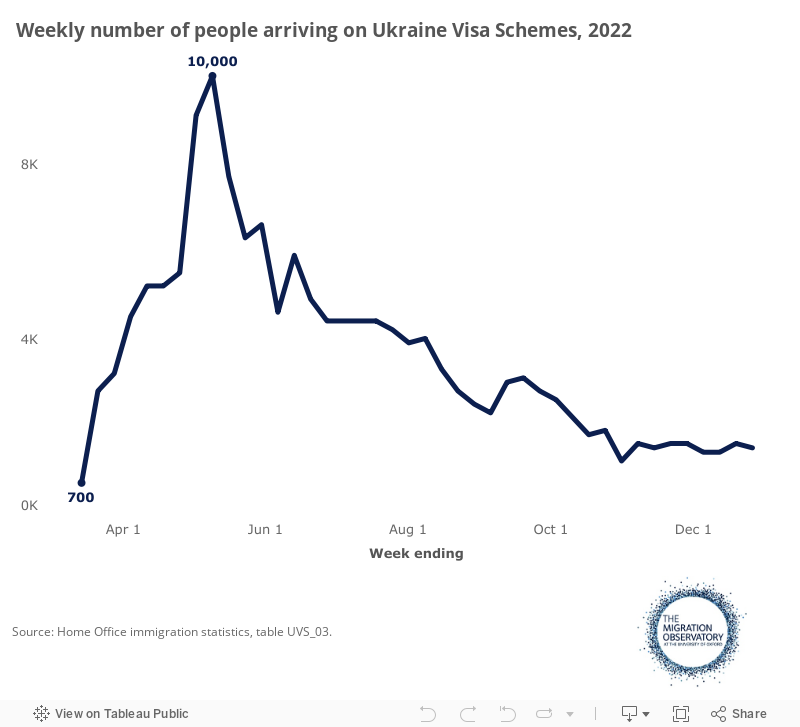
The crisis in Ukraine has been an important driver of increased non-EU visa grants. The numbers of people arriving from Ukraine was highest in the early weeks after the Russian invasion and have since tapered off. Arrivals peaked at 10,000 in a single week in early May 2022 and had fallen to around 1,500 per week by December that year. In the medium term, the numbers might increase again if conditions in Ukraine deteriorated. But in the long term, the Ukraine schemes are not expected to continue indefinitely.
Figure 7
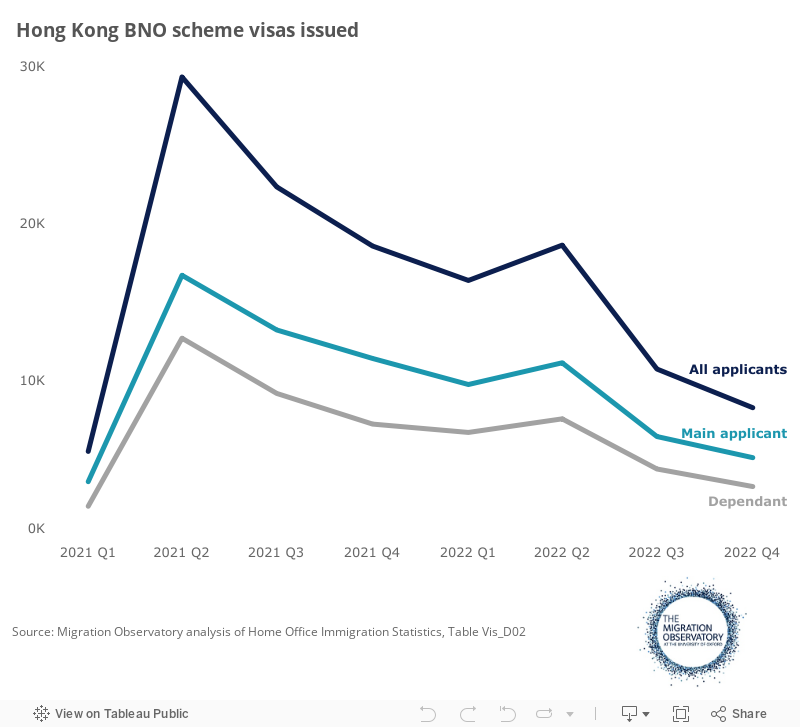
The number of BNO visas that will be issued in future is uncertain and will depend, among other things, on conditions in Hong Kong. For the time being, however, the number of visa grants has declined substantially since the initial peak (Figure 8). This is consistent with Home Office modelling of the BNO route, which assumed that the number of applicants would be highest in the first year and then fall substantially.
Figure 8
Study and work visas
As new data emerge over the coming year, it should become clearer whether and how quickly increases in study and work visas will start to level off. Most student visa grants take place in the summer, so a clearer picture on trends in student visas will not be available until statistics for the third quarter are published in November.
It is also difficult to predict how long the boom in recruitment of overseas health and care workers will last. The care industry has faced serious shortages in recent years, in large part because funding has been insufficient to offer attractive pay and conditions. In the NHS, the number of UK training places also plays a crucial role (in addition to pay and conditions, which affect retention). While the number of nurses starting training in the UK increased by 29% from 2016/17 to 2021/22, there are also concerns about retention. For example, the number of nurses leaving the NHS in England also increased sharply in the year ending June 2022 and declining real-terms pay is also expected to make retaining nurses more difficult. Higher spending on training and pay in the health and care sector may in theory mitigate the UK’s reliance on overseas workers, although this of course comes at a cost and competes with other government spending priorities.
Meanwhile, take-up of visas in industries where some middle-skilled jobs are newly eligible for the immigration system—such as construction and hospitality—was initially relatively low, both among EU and non-EU citizens. However, recruitment appeared to pick up in the second half of 2022, particularly in hospitality and manufacturing. This increase may result from employers becoming more familiar with the immigration system and taking the time to become licensed sponsors.
Future outlook
In summary, we cannot assume that the current level of visa grants is a ‘new normal’. The recent period has been unusual in several ways. In particular, substantial numbers of visa grants to Ukrainian citizens and Hong Kong BNO status holders are not expected to continue indefinitely. For work and study, the long-term prognosis is less clear: there are plausible scenarios in which visa grants decrease, but also where they remain high for some time—especially if recruitment and retention of domestically trained health and care professionals does not improve.
What does the higher number of visa grants mean for immigration and net migration?
The analysis above shows that visa grants to non-EU citizens has increased in recent years. While not all visa grants lead to long-term immigration, ONS estimates of non-EU immigration have also increased. Figures published in November 2022 (covering the year ending June 2022) estimated long-term immigration of non-EU citizens at 704,000. This contributed to unusually high net migration of 504,000.
Net migration—defined as long-term immigration minus emigration—is a measure the contribution of international migration to the UK population. In contrast to other countries, political debates in the UK have often focused on net migration rather than immigration.
Emigration and net migration
Net migration depends on both immigration and emigration. Many non-EU citizens come to the UK for periods of a few years before emigrating again. These temporary migrants contribute to immigration in the short run but contribute much less to net migration or to population growth over the long term.
In theory, higher immigration since 2021 should lead to higher emigration, but not immediately—there is a lag between the two. In the coming years, an increase in emigration may therefore be expected to contribute to a decline in net migration, all else equal.
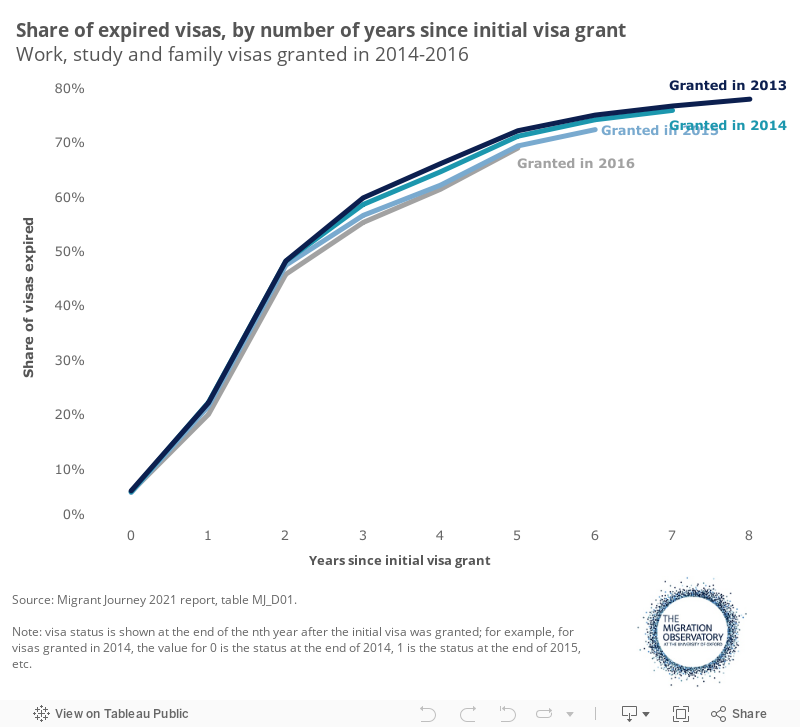
To illustrate this point, available data show that the majority of non-EU citizens granted visas were been temporary migrants in recent years (Figure 9). About half of non-EU citizens granted status in the UK in the mid-2010s had seen their visas expire by the end of the second or third year after their initial visa was granted and thus were expected to have left the UK. (This figure includes visa grants for work, study and family, as well as grants of protection.) Around three-quarters had seen their visas expire by the end of the seventh year.
Figure 9
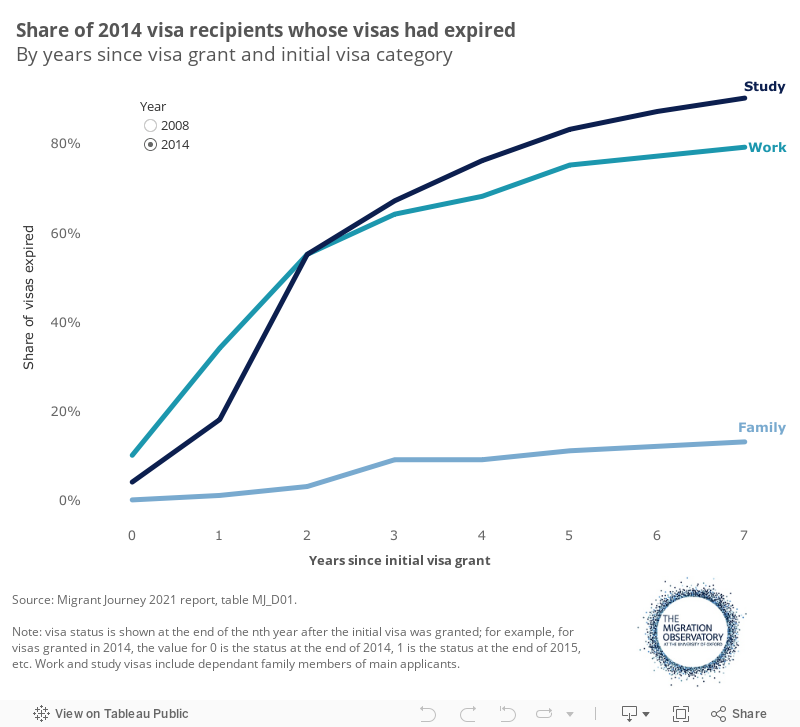
In the past, international students have been most likely to leave the UK compared to other groups of migrants (Figure 10). Among students receiving their initial visas in 2014, for example, just over half had seen their visas expire by the end of 2016 and thus were expected to have left the country. At that time there was no post-study work route, so current student cohorts are expected to stay somewhat longer on average—although post-study work nonetheless does not provide a direct route to settlement. If we look back to student visas granted in 2008, when the previous post-study work regime was in place, a lower share of students saw their visas expire, but nonetheless 83% of the visas had expired by the end of the seventh year after arrival (Figure 10).
Figure 10
The fact that emigration takes place a few years after immigration means that when immigration is increasing, net migration estimates are expected to go up in the short run, even if the people in question will eventually leave. As a result, theory predicts that net migration will be unusually high in the 1-3 years after an increase in immigration of the kind that the UK is currently experiencing—even if the number of people arriving in the UK does not decline.
Acknowledgements
This analysis was produced with the support of Trust for London. Thanks to Alan Manning and Jonathan Portes for comments on an earlier draft, to Hector Hurmuz-Sklias for producing the visualisations, and to Zachary Fajth-Strain and Kotaro Oriishi for research assistance.
Appendix Table 1
Home / publications / commentaries /
Why has non-EU migration to the UK risen?
21 Nov 2022