
This briefing examines the role of EU citizens in the UK labour market, including their number, the jobs they do, and their economic outcomes.
-
Key Points
- The number of EU-origin workers in the UK labour market increased substantially in the 2010s, although growth slowed after the EU referendum and reversed during the COVID-19 pandemic. Under the post-Brexit immigration system, non-EU-origin workers replaced EU-origin workers as the main source of growth in the migrant workforce.
More… - Non-EU origin workers now outnumber EU even in some industries that previously relied heavily on free movement for EU citizens (e.g. retail, hospitality, and administrative and support services). As a result, the EU share of the employee workforce has fallen considerably.
More… - EU workers generally have high employment rates, low unemployment and low inactivity, although they have been more vulnerable to spikes in unemployment during periods of economic weakness.
More… - Average earnings among EU-born citizens in the UK are similar to the UK-born, but there is large variation by place of birth and year of arrival.
More… - One factor contributing to lower earnings among workers from Member States that joined the EU in 2004 or later is relatively high levels of over-qualification.
More…
- The number of EU-origin workers in the UK labour market increased substantially in the 2010s, although growth slowed after the EU referendum and reversed during the COVID-19 pandemic. Under the post-Brexit immigration system, non-EU-origin workers replaced EU-origin workers as the main source of growth in the migrant workforce.
-
Understanding the Evidence
Different UK data sources count migrants originating from the EU in different ways. ... Click to read more.The three main definitions are:
- Country of birth: this allows us to examine change over time, even after migrants have become UK citizens, although it will exclude some EU citizens, such as those who were born in non-EU countries and acquired EU citizens either through ancestry or residence in the EU. Census data also provide more detail for country of birth than for nationality.
- Nationality: UK survey data (e.g. the Labour Force Survey and the Annual Population Survey) ask respondents for their nationality; this is self-reported and only one nationality is captured, which may mean that dual EU/non-EU citizens are undercounted. The Census instead asks for passport held; this may lead to lower respondent error, but may exclude some people who are citizens of a country but do not have a passport. Home Office visa data provide an accurate measure of citizenship at the time of the visa application.
- Original nationality, or nationality on registration for a national insurance number: UK administrative records (including employee payroll data) identify migrants based on their nationality at the time they applied for a national insurance number (NINo). This will exclude some people who become UK citizens before registering for a NINo, or who arrived in the UK before age 16 and did not go through the adult registration process.
After two decades of growth, the EU-origin workforce slightly declined post-Brexit
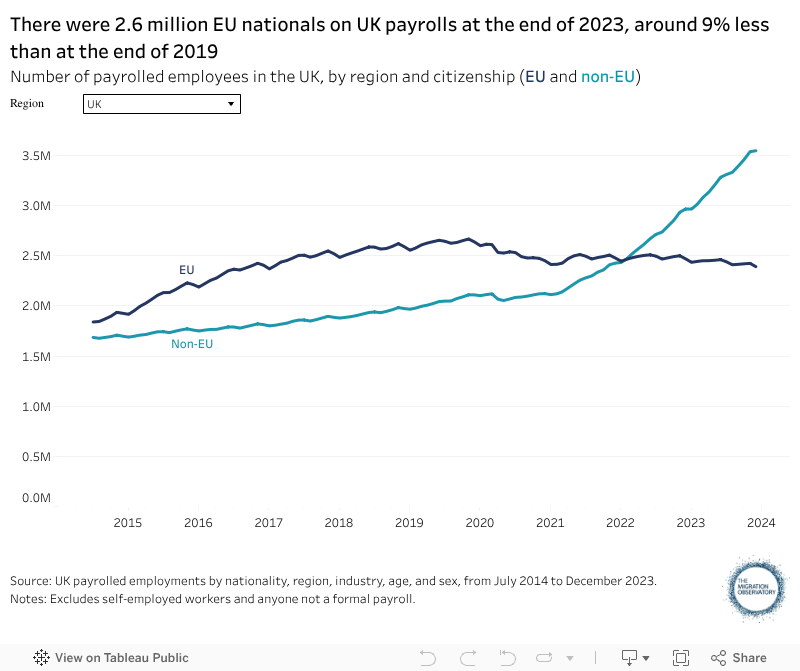
Until the COVID-19 pandemic and the UK’s exit from the European Union, the total number of workers from European Union member states in the United Kingdom had risen steadily for two decades. The number of EU citizen employees on payroll[1] in the UK grew from 1.8m in July 2014 to a peak of 2.7m in November 2019 (Figure 1).
By the end of 2023, EU employee numbers had fallen by around 9%, to around 2.4 million. The number of EU employees declined in 2020 due to the pandemic, bounced back slightly in 2021-22, then continued to decline slowly in 2023.
However, the most noteworthy shift in the UK labour market in recent years has been the sharp growth in the number of non-EU citizens after the pandemic. This increase reflects high levels of non-EU migration, most of which was not through work-related routes. Instead, non-EU migration has come mainly through non-work schemes, including visas for Ukrainians, Hong Kong British National Overseas status holders, and international students.
Until 2019, the growing number of EU employees also meant that EU citizens made up a rising share of the overall employee workforce in the UK, although the growth slowed after the 2016 referendum. A combination of the decline in EU workers during the pandemic and the growth of UK and non-EU workers during the post-pandemic economic recovery pushed down the EU share of the employee workforce, however. It fell from a peak of 8.6% at the end of 2019 to 7.4% at the end of 2023. The latter was similar to 2015 levels.
A similar trend of rising non-EU employment and stable or falling EU employment has unfolded within each region of the UK. Of the 12 regions and nations of the UK, EU employees only still outnumber non-EU ones in one – Northern Ireland (Figure 1).
Figure 1
The figures above do not include the self-employed. At the time of the 2021 England and Wales Census, 454,000 EU passport holders were self-employed, making up 19% of EU citizens in employment (however, more detailed data, such as on the specific industries in which self-employed non-UK citizens work, were not available).
EU employees are employed across many different industries
The composition of jobs that EU workers do is expected to shift over time as a result of Brexit and the new immigration system, which — compared to free movement — greatly restricted the options for EU citizens to work in occupations that are not classified as skilled (i.e. not requiring at least A-Level education and meeting salary thresholds). However, changes such as these take place gradually over a number of years, because most workers who arrived under free movement rules remain employed in the UK.
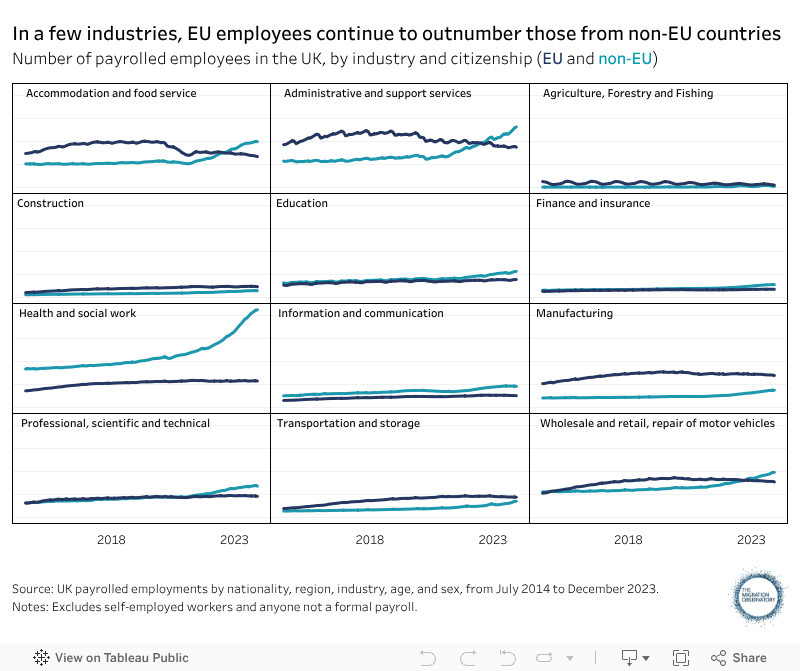
At the end of 2023, the largest industries for EU employees were administrative and support services, which include a range of mostly low-wage service jobs such as commercial cleaning (349,000), retail (307,000), manufacturing (276,000), and hospitality (267,000). Hospitality saw the largest decline in EU employees during the pandemic, and even after employment in the industry picked up with the economic recovery, most likely because the post-Brexit immigration system restricts employment in low-wage jobs.
In most industries, non-EU employee numbers increased considerably after 2021. In effect, the growth in the migrant labour force that had previously come from EU workers before Brexit now comes from non-EU workers. This trend has occurred even in industries with high share of jobs ineligible for post-Brexit work visas, which were expected to be hit hardest by the end of free movement. But as noted earlier, most non-EU migration has not come through work routes. As a result, many non-EU citizens entering the labour market will not face any restrictions on the occupations they can perform.
Figure 2
A similar chart with further breakdowns is available as Figure 6 here.
The result of falling or flat EU employment and rising non-EU employment is that in certain industries, the EU share of the employee workforce has fallen considerably. For example, the EU share of the hospitality industry fell from 18% to 12% from December 2019 to December 2023, while the share in administrative and support services fell from 17% to 13%.
By the end of 2023, non-EU workers had surpassed the number of EU workers in several industries, including hospitality and administrative and support services. However, EU workers continued to dominate in construction, manufacturing, and logistics.
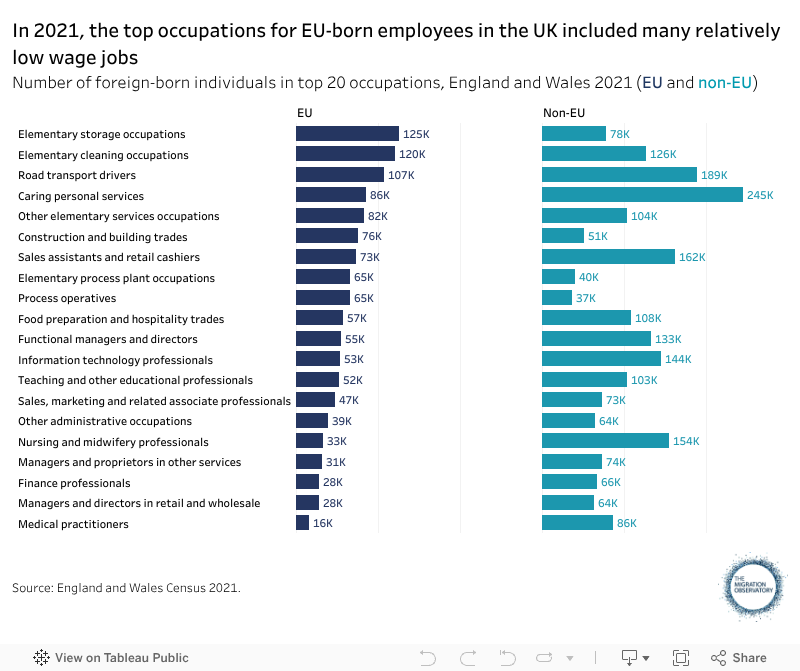
Figure 3 shows the largest individual occupations employing EU and non-EU employees at the time of the March 2021 Census in England and Wales. Although the Census took place during the pandemic, it remains the best source for examining fine-grained occupation data. Many of the largest occupations employing EU-born workers in 2021 were relatively low-wage jobs such as warehousing, cleaning and care. However, these patterns are likely to have changed somewhat after 2021, as seen above, EU employment in several industries like hospitality and retail has declined significantly, which is likely to have affected some of the most common low-skilled occupations identified in the Census.
The top occupations also included some higher-paying jobs, such as in IT, finance, or management. Migrants from non-EU countries were comparatively more likely to work in sectors like retail, care, and medical professions.
Figure 3
EU workers generally have high employment rates, low unemployment and low inactivity
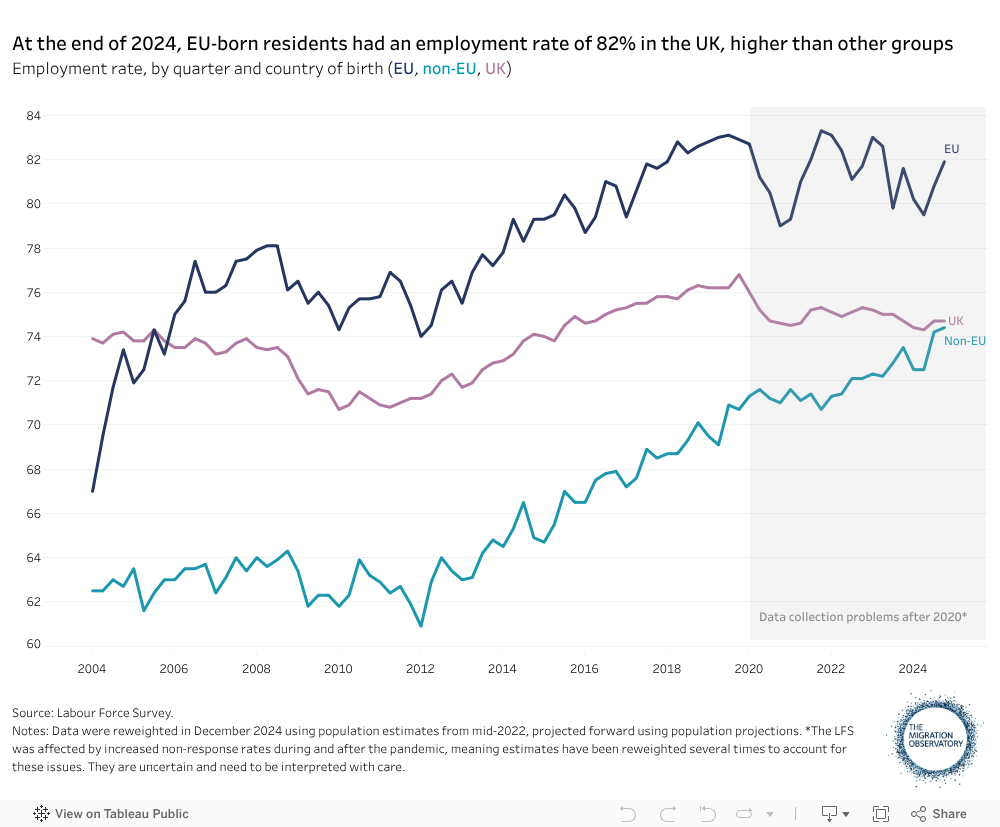
EU migrants have had high employment rates over the past two decades, and their employment rates increased over time. By the last quarter of 2024, the EU-born had an estimated employment rate of around 82%, compared to around 74% for the non-EU born and 75% for the UK-born. Estimated figures for EU nationals were similar, at around 81%.
Figure 4
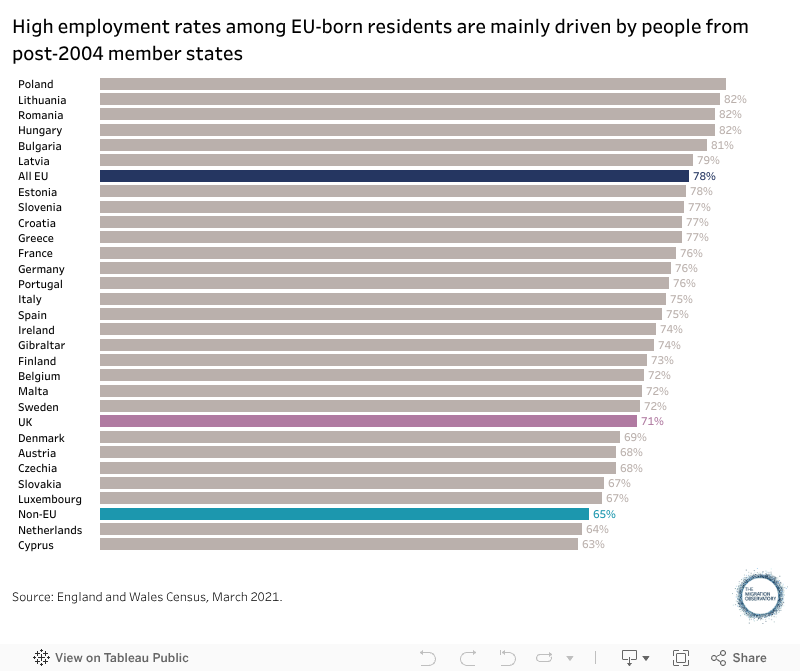
The employment rate varies among residents born in different EU Member States. Country-specific employment rates are most robust when taken from Census data, although readers should remember that the Census took place during the early 2021 lockdown when employment was lower than usual. If people from some countries faced larger temporary setbacks in the labour market due to COVID-19, this will have affected the relative position of different groups.
With this caveat in mind, data from the England and Wales Census show that the higher-than-average employment rate for EU migrants – 78% among people aged 16-64 born in an EU country – was driven primarily by migrants from newer EU member states such as Poland, Lithuania and Romania. Exceptions to this general trend include people born in Slovakia and Czechia, who had lower employment rates in March 2021. Across groups, men had a slightly higher employment rate than women (82% vs. 75%, among all EU-born residents).
Figure 5
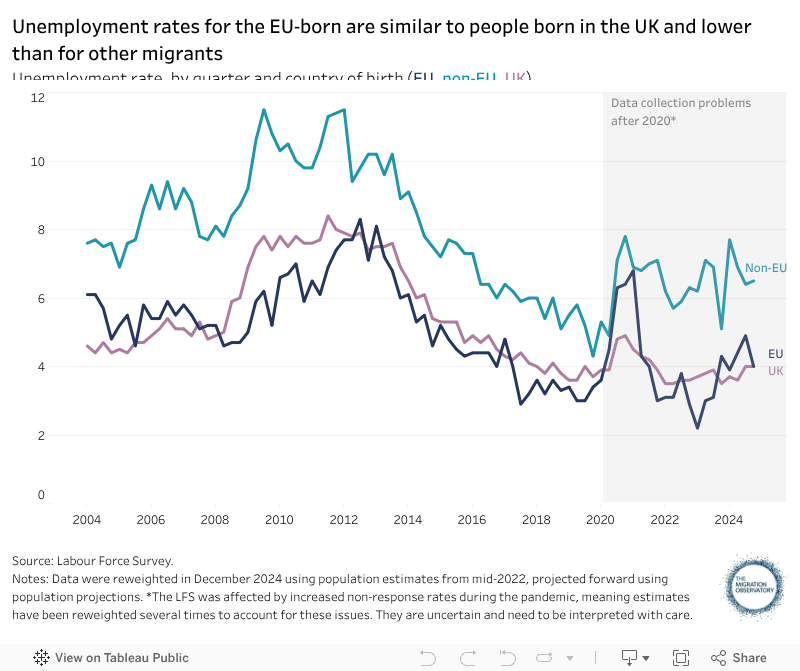
EU migrants have typically had the lowest unemployment rates of the three main country of birth groupings (EU, non-EU, UK). However, EU unemployment has been somewhat more responsive to shocks like the pandemic (6.5% in Q1 2021). By the end of 2024, the EU-born had an estimated unemployment rate of 4% (Figure 6).
Figure 6
Finally, a relatively low share of EU migrants are economically inactive (i.e. not working and not looking for work, for example, due to caring responsibilities or study). In the last quarter of 2024, an estimated 15.1% of EU-born people aged 16 to 64 were economically inactive (down from over 24% in 2005). In comparison, the share was 21.8% among people born in the UK and 21.4% among those born in non-EU countries.
Average earnings among EU-born citizens in the UK are similar to the UK-born
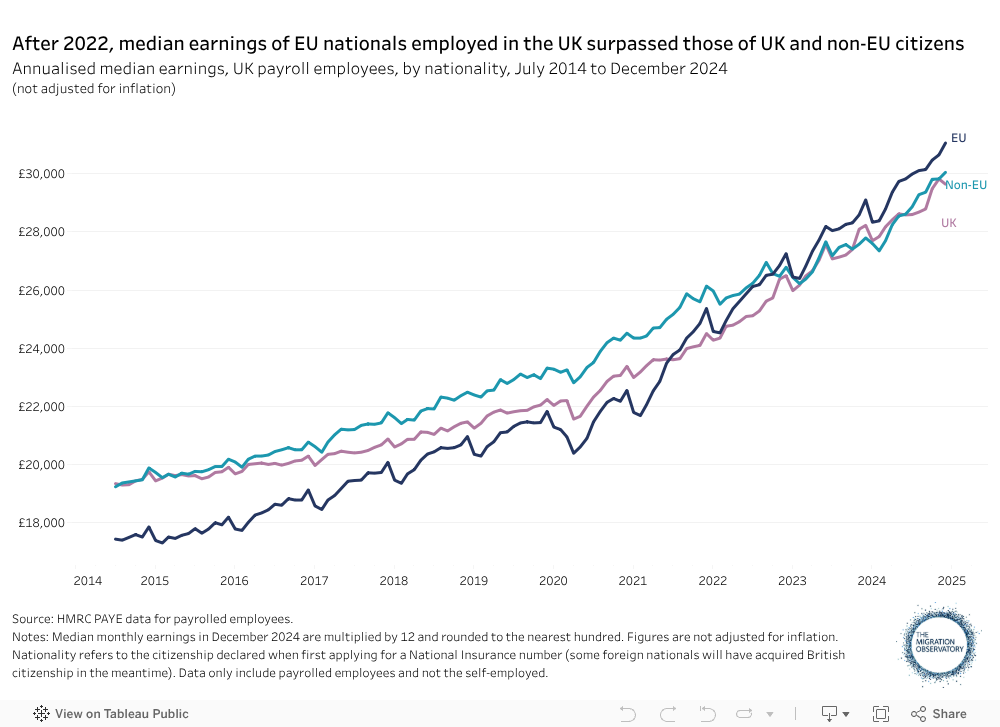
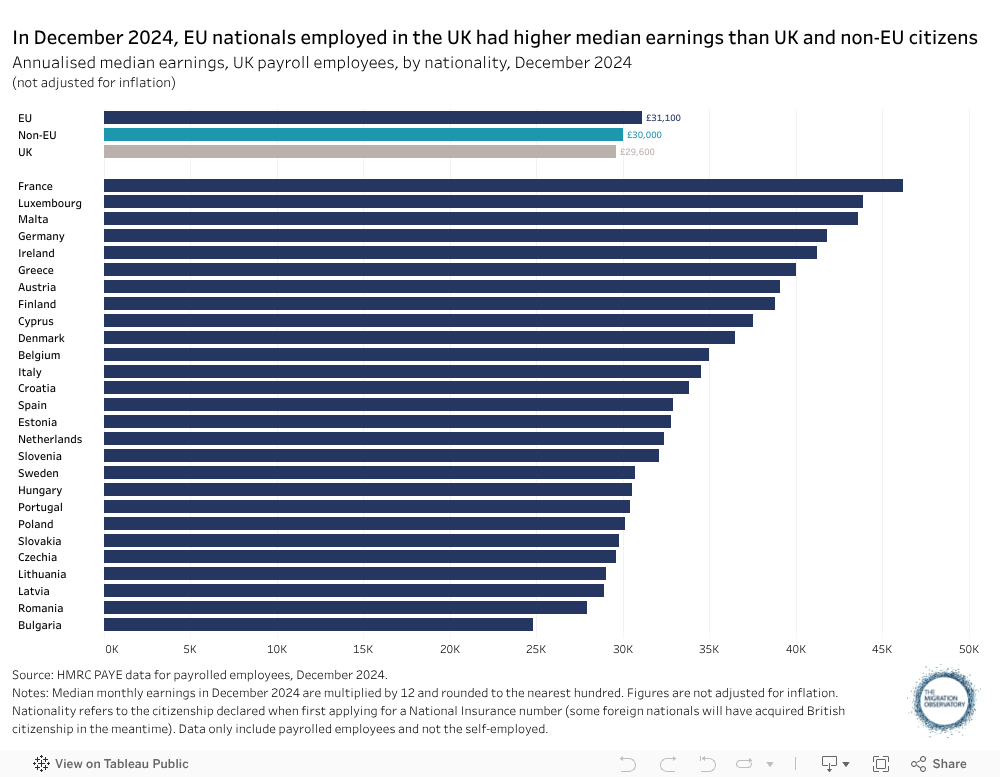
Annualised median earnings among EU-origin employees in the UK stood at £31,100 a year in December 2024, slightly higher than among British or non-EU citizens. This marks a significant change in recent years – between 2014 and 2021, EU nationals earned least among the three groups (Figure 7).
In large part, median incomes among EU nationals rose faster after the pandemic because of changes in the composition of the migrant population. First, immigration from the EU fell sharply under the post-Brexit system. As a result, EU employees have now, on average, spent longer periods of time in the UK, and incomes tend to increase over time among migrants. Second, significant numbers of EU nationals have also emigrated, meaning EU employment in several low-wage industries like hospitality has fallen, particularly after 2021 (Figure 2). This shifting composition led to changes in median earnings, as shown below (data on the overall earnings distribution of EU employees were not available, though this likely continues to include significant numbers of people in low-wage jobs).
In recent years, an unusually large number of non-EU migrants have arrived in the UK, many to take up jobs in low-wage sectors like social care.
Figure 7
Median earnings vary considerably between European nationalities, from a high of £41,600 among French citizens to a low of £24,800 a year among Bulgarian nationals (Figure 8). This is linked to the different kinds of jobs that EU nationals have in the UK – nationalities with lower earnings are overrepresented in lower-wage occupations and industries, such as hospitality and support services.
Figure 8
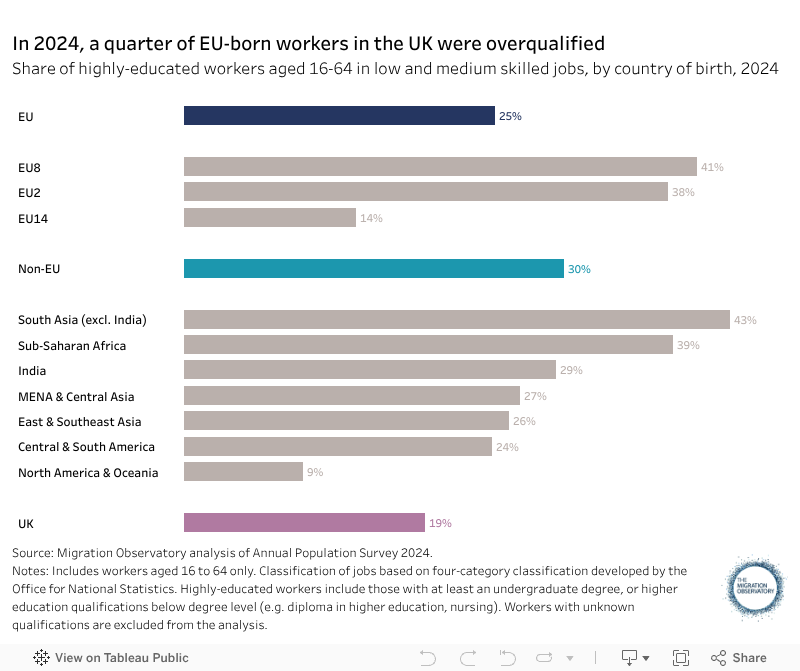
Over-qualification has contributed to lower earnings for some EU-origin workers
One reason for low earnings among people born in new Member States is over-qualification. Compared to people born in the UK, the EU-born are more likely to work in jobs for which they are overqualified, especially if they have foreign qualifications. In general, workers are considered overqualified for their jobs if their educational level is above that required for their jobs. Some of the factors explaining non-citizens’ high over-qualification rates include the lack of UK-specific skills, employers’ mistrust of or unfamiliarity with foreign qualifications, or migrants’ lack of information about the job searching process in the UK.
Around 25% of highly educated workers born in EU member states were in low and medium-low-skilled jobs in 2024 (Figure 9). Importantly, the migrant groups with the lowest earnings were also the ones most likely to be over-qualified for their jobs.
Workers who were born in newer EU2[2] and EU8[3] Member States had higher shares of overqualified workers in 2024, at 38% and 41%, respectively. This compares to just 14% of people born in EU14[4] countries that were member states before 2004.
Figure 9
Evidence gaps and limitations
None of the currently available data sources on EU workers in the UK labour market provide any information about immigration status, including whether people have status under the EU Settlement Scheme or a visa under the post-Brexit immigration system. Developments in migration statistics over the coming years may make at least some of this information available, however.
Footnotes
[1] Employee figures from payrolls are similar to those from the 2021 Census. These showed that, of 3.8 million EU passport holders in England and Wales, 2.28 million were in full time employment (2.39m when including full-time students who were also employed). Among EU passport holders, there were around 353,000 full-time students, 513,000 economically inactive people, and 610,000 people aged below 16 or over 65.
[2] Romania and Bulgaria
[3] Czechia, Estonia, Hungary, Latvia, Lithuania, Poland, Slovenia, Slovakia
[4] Pre-2004 Member States: Austria, Belgium, Denmark, Finland, France, Germany, Greece, Ireland, Italy, Luxembourg, the Netherlands, Portugal, Spain, and Sweden