
This briefing provides data on migrants’ labour market integration and the jobs they do in the UK labour market. It also presents data on migrants’ employment and unemployment rates, occupational status, earnings, and contract types.
-
Key Points
- In December 2025, 19% (or 5.9 million) of UK employees were adult migrants.
More… - Men born outside the UK were more likely to be employed than UK-born men, but among women, migrants were less likely to be in employment.
More… - Unemployment rates have been higher among migrants than the UK-born over the past two decades.
More… - In December 2025, 13% of individuals in receipt of a Universal Credit payment were neither UK nor Irish nationals, marginally lower than their share in the wider population.
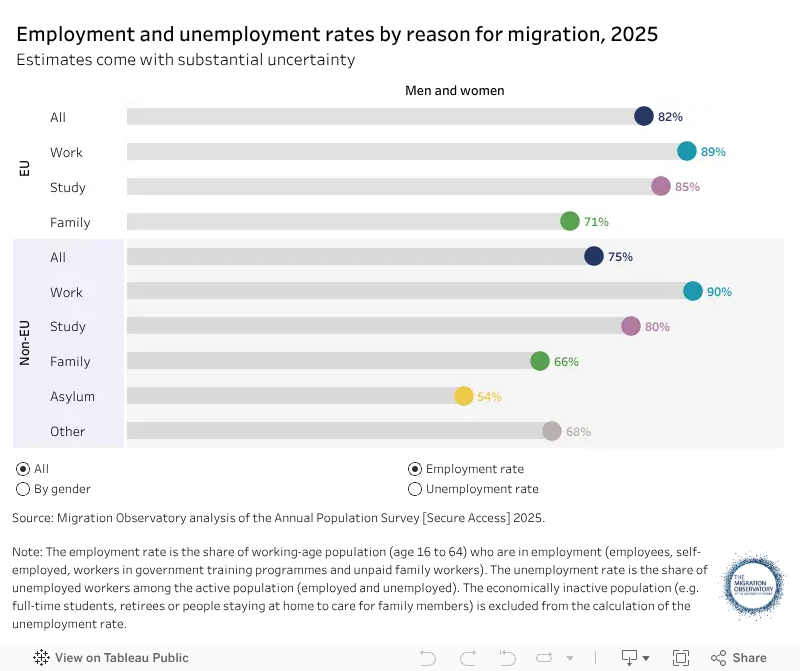
More… - Non-EU-born migrants who moved to the UK seeking asylum were less likely to be employed than those who moved for employment, family or study reasons.
More… - Migrants are overrepresented in the administrative services, hospitality, and health and care sectors.
More… - Workers born in North America and Oceania were most likely to be in high-skilled occupations, while those born in new EU member states (EU8 and EU2) were the most likely to be in occupations classified as low-skilled.
More… - The annualised median earnings of EU and non-EU employees were slightly higher than those of UK nationals in December 2025.
More… - Many highly educated migrant workers are overqualified for their jobs.
More… - Foreign-born workers were more likely to work during night shifts and in non-permanent jobs than the UK-born.
More…
- In December 2025, 19% (or 5.9 million) of UK employees were adult migrants.
-
Understanding the Evidence
The two datasets used in this briefing define migrants differently. In statistics calculated using the ONS’s Annual Population Survey (APS), migrants are defined as individuals born outside the UK, regardless of whether they have become UK citizens. ... Click to read more.By contrast, figures from HMRC data on employment counts and employee earnings define migrants as individuals who had a non-UK nationality when they applied for a National Insurance Number. See the Migration Observatory briefing, Who Counts as a Migrant: Definitions and their Consequences, for a further discussion of this terminology.
Both datasets also have strengths and limitations in terms of timeliness, coverage, and level of granularity. Neither provides a complete picture of the labour market, and in this briefing, we switch between them in order to cover different topics. The rest of this section contains more information on each of the sources.
The Annual Population Survey
The APS is the largest household survey in the UK. It is derived from the Labour Force Survey (LFS), which provides official measures of employment and unemployment, alongside sample boosts sponsored by government agencies. Some people are excluded from the survey, such as residents of communal establishments like hostels, while other groups may be undercounted due to survey non-response.
Face-to-face interviewing for the LFS was suspended in March 2020 due to the pandemic, with respondents instead interviewed by telephone. This change in data collection mode impacted the survey’s response rate, and in October 2023, scheduled LFS estimates were suspended due to quality concerns. Face-to-face interviewing was subsequently reintroduced for the first two waves of interviews, leading to improvements in response rates. However, estimates from the LFS and APS still come with a high degree of uncertainty.
All of the differences described in the narrative of the briefing are statistically significant – that is, they are likely to exist in the population, rather than being caused by chance. Note, however, that small differences between estimates for different groups may not be statistically significant if they are not described in the narrative of the briefing.
HMRC employee counts and employee earnings
This briefing also uses HMRC statistics that combine Pay As You Earn Real Time Information (RTI) with data from the Migrant Worker Scan (MWS). The former contains information on all payrolled employee jobs that were active in a given month, including the age and sex of the employee, the industry and broad region where the role was located, and the gross earnings the employee received in that month. MWS is a record of people who were non-UK nationals when they were issued a National Insurance Number (NINo). New NINos are issued to all non-UK nationals aged 16 and above who are working, planning to work legally, or claiming benefits in the UK, regardless of the duration of their intended stay in the UK. As a result, we can see the number of employee jobs held by people who were adult EU or non-EU nationals when they arrived in the UK, even if they have since obtained UK nationality.
However, the data do have some important limitations. First, they do not record self-employment or off-payroll employment (i.e., the hidden economy or casual work). This means the figures do not fully reflect labour market patterns, particularly in sectors where self-employment or cash-in-hand work is more common, such as construction. Second, the data refer to employments rather than employees—in other words, if an individual has two jobs, they will be counted in the data twice. Third, non-UK nationals who moved to the UK before the age of 16 are recorded as UK nationals, whereas individuals who arrived as non-UK nationals but subsequently acquired British citizenship will still be recorded as non-UK nationals. For example, somebody who was issued a NINo when they had Indian citizenship would be recorded as an Indian national, even if they later acquired British citizenship. In this briefing, we refer to people who were non-UK citizens when they first registered for a NINo as ‘adult migrants’.
-
Understanding the Policy
The people this briefing examines will have migrated to the UK over the course of several decades under a number of different policy regimes. ... Click to read more.For the majority, work will not have been the main reason for migration (see the Migration Observatory briefing Where do migrants live in the UK for information on the main reason for migration of the foreign-born population). For more information on work visas and people who move specifically for work, see the Migration Observatory briefing Work visas and migrant workers in the UK.
Across Europe, labour market integration policies tend to focus on recently arrived migrants and could include job search assistance, recognition of foreign qualifications or provision of specific skills, such as language courses or vocational and non-vocational training. For an overview of labour market integration policies in Europe, see the MIPEX report Evaluating Impact: Lessons Learned from Robust Evaluations of Labour Market Integration Policies.
The UK does not have an overarching policy on migrants’ labour market integration, although the 2019 Home Office Integration framework – published when the Conservative Party was in office – emphasised that positive labour market outcomes were key for migrants’ wider integration. For more information about policies on integration, see the Migration Observatory policy primer, Integration.
In December 2025, 20% of employees were non-UK nationals at the time they registered for a national insurance number
The share of employee jobs held by people who were non-UK citizens when they first registered for a national insurance number (‘adult migrants’) has steadily increased over the past decade, rising from 12% in July 2014 (3.5 million) to 20% in December 2025 (6.5 million) (Figure 1). This is higher than the share of employees who were adult non-UK citizens in December 2025 – 19%, or 5.9 million – because migrants were more likely to hold multiple jobs. Neither of these measures includes the self-employed population or those working in cash-in-hand jobs, however.
London had the highest proportion of employee jobs held by non-UK citizens (43%), while Wales (10%) and the North East (11%) had the lowest.
In the years before Brexit, there were more employee jobs held by EU than non-EU adult migrants. This was a period when EU net migration to the UK was high, as EU citizens faced relatively few restrictions under free movement rules. Since the introduction of the post-Brexit immigration system in January 2021, however, non-EU citizens have been the major source of growth in the migrant workforce. This growth was driven primarily by high levels of recruitment into health and care roles, particularly care work. For more information about net migration from EU and non-EU countries, see the Migration Observatory Briefing, Net Migration to the UK.
Figure 1

Between January 2021 and December 2025, the sharpest increases in the number of jobs held (in absolute terms) were among Indian and Nigerian adult employees (Figure 2). Over the same period, the number of employee jobs held by adult nationals of EU8 and EU2 countries declined (by 16% and 7% respectively).
Figure 2

Non-UK-born men were more likely to be employed than UK-born men in 2025, but migrant women were less likely to be in employment
There are many factors that shape migrants’ employment rates in the UK, ranging from their level of education and skills, how well they speak English, family and caring responsibilities, social networks, the extent to which UK employers recognise their foreign qualifications, and discrimination. More information about English language use among migrants is available in the Migration Observatory briefing, Language Use and Proficiency of Adult Migrants in the UK.
Migrants’ employment rates will also differ depending on the measure used. The figures below define a migrant as a person born outside the UK, and they include self-employed individuals. This differs, therefore, from the previous section, which defined migrants as those who were non-UK citizens when they registered for a national insurance number and only included employees on payrolls.
In 2025, the employment rate of working-age migrant men was higher than that of UK-born men (83% and 77%, respectively) (Figure 3). Most region-of-birth groups had higher employment rates than UK-born men. Among women, the employment rate for working-age migrants was 72%, slightly lower than for the UK-born (73%). EU-born women had significantly higher employment rates (79%) than non-EU-born women (69%).
Women from Middle Eastern, North African, Central Asian and South Asian countries (excluding India) had particularly low employment rates, with looking after the family home the primary reason: among women from these regions who were not in employment in 2025, 49% of those born in South Asian countries (excluding India) cited this as the reason they were not employed, as did 28% of women born in MENA and Central Asia.
Figure 3

The gender employment gap—the difference between the employment rates of men and women—is smallest among the working-age population born in North America, East and Southeast Asia, and Oceania, but largest among migrants born in South Asian countries (excluding India), for which women’s employment rate was 35 percentage points lower than that of men.
As with employment, unemployment rates vary widely by country of birth and gender (Figure 3). They have generally followed similar trends for both migrants and the UK-born over the past two decades. After sharp increases in the aftermath of the 2008 financial crisis, the unemployment rate steadily declined from 2012 to 2019 before the economic downturn caused by the COVID-19 pandemic led to another steep rise (Figure 4).
The unemployment rate rose for UK- and foreign-born residents between 2023 and 2024. While this increase may owe to lower employer demand for workers, methodological issues with data collection mean these figures are highly uncertain (see Understanding the Evidence, above, for more information).
Figure 4

In December 2025, 13% of individuals in receipt of a Universal Credit payment were neither UK nor Irish nationals
In December 2025, 13% (1.1 million) of individuals in receipt of a Universal Credit (UC) payment were non-UK (and non-Irish) nationals aged 16 or over at the time they registered for a National Insurance Number (Figure 5). This is lower than their share in the wider population—according to the 2025 Annual Population Survey, 16% of the working-age population was born outside of the UK/Ireland and moved to the UK after the age of 16. Note, however, that neither the British nor migrant figures include ‘legacy’ benefits that UC replaced.
In general, migrants living in the UK with temporary immigration statuses – such as a work, study or family visa – are not eligible for benefits because they are subject to the “No Recourse to Public Funds” (NRPF) condition, which prevents access to state-funded welfare. By contrast, people who came to the UK after Russia’s invasion of Ukraine, as well as those with refugee status or settlement, can claim UC. These groups may have driven the increase in the share of payments to individuals with a non-EEA nationality. Among EEA nationals, the increase likely owes to people who arrived in the UK before the end of free movement and hold status under the EU Settlement Scheme.
The share of migrants subject to NRPF will likely fall in the second half of the decade, as people who came to the UK in the early 2020s – when net migration was unusually high – become eligible to acquire settlement. This may lead to an increase in the share of non-UK nationals claiming Universal Credit.
Figure 5

In the year ending March 2025, the Department for Work and Pensions made £65.4 billion in Universal Credit payments, of which 10% (or £6.25bn) was paid to households with at least one EEA-national claimant and 8% (or £5.31bn) to households with at least one non-EEA-national claimant. These figures cannot be combined, as some households comprise both EEA and non-EEA claimants. They also include payments to UK and Irish claimants living in the same household as an EEA or non-EEA claimant.
Non-EU-born migrants who moved to the UK seeking asylum were less likely to be employed than those who moved for work, study or family reasons
Migrants who came to the UK for work were the most likely to be employed – and the least likely to be unemployed – in 2025. Among non-EU migrants, those who initially came to the UK seeking asylum had both lower employment rates and higher unemployment rates than other non-EU migrants (Figure 6). Several factors may have contributed to this, including the fact that refugees tend to have smaller social networks to support the process of finding a job, and often have a lower health status, particularly in terms of mental health. There is also some evidence that restrictions on asylum seekers working while their applications are being processed can lead to worse long-term labour market outcomes.
Administrative data show that refugees’ employment rates increase with time spent in the UK but remain low.
Figure 6
Migrant employees are overrepresented in the admin services, hospitality, and health and care sectors
In December 2025, a quarter of the jobs held by employees with non-EU nationalities when they registered for a national insurance number (‘adult migrants’) were in the health and care sector (Figure 7). This share stood at 22% in February 2022 but rose sharply after care workers were made eligible for Skilled Worker visas—161,000 Skilled Worker visas had been granted to non-EU care workers by the end of 2025. In Wales, Northern Ireland, and the South West, adult non-EU nationals were even more likely to work in health and care in December 2025, with around a third of employee jobs in the sector.
By contrast, EU employees were more evenly distributed across the labour market, with administrative services, retail, and manufacturing the most common sectors. Just over a third of jobs held by adult EU8 nationals in December 2025 were in either the retail or manufacturing sectors, while adult nationals of EU14 and EU2 countries were most likely to work in administrative services.
Note, however, that because these figures only include employees, they do not fully capture working patterns in sectors with higher levels of self-employment or cash-in-hand work, such as construction. In addition, it is more common for people to work multiple jobs in certain industries, which may lead to some proportions being overstated.
Figure 7

A fifth of employee jobs were held by adult non-UK nationals in December 2025, but their presence varied considerably across sectors (Figure 7). For example, adult non-UK nationals were overrepresented in administrative services, hospitality, and health and care but underrepresented in public administration and the arts.
In London, 64% of hospitality roles were held by non-UK employees, the highest proportion in any sector-region pairing across the UK. For context, 43% of employee jobs in London were held by non-UK nationals across all sectors.
Non-UK workers were slightly more likely than UK-born workers to be in high-skill occupations
Taken as a whole, the occupational distribution of migrant workers did not differ much from that of UK-born workers in 2025, although migrants were slightly more likely to be working in jobs classed as both high- and low-skill than the UK-born (Figure 8). A majority of both migrants and UK-born workers were in middle-skilled jobs, which include occupations such as associate professionals, administrative jobs, sales assistants and some care work.
There are considerable differences in the type of jobs workers do by region of birth, however (Figure 8). Almost 60% of workers born in North America and Oceania were in high-skilled jobs in 2025, the most common of which among the overall migrant population were IT specialists, teachers, and managers. By contrast, the share of workers born in new EU accession countries (EU8 and EU2) who were working in high-skill jobs was only a little over 20%. Migrants from these countries were most likely to be working in low-skill occupations, which include jobs such as cleaners, waiters, and packers.
Figure 8

Figure 9 shows the ten occupations that were most reliant on workers born in EU and non-EU countries. Care workers and health professional jobs, such as doctors and nurses, had the highest share of non-EU-born workers in 2025. By contrast, low-skilled factory and construction—which includes jobs such as machine operators in food factories and assemblers—had the largest share of EU-born workers.
Figure 9

The annualised median earnings of EU and non-EU employees were slightly higher than UK nationals in December 2025
Employees’ earnings are closely related to the occupations they hold. Migrant groups most concentrated in high-skilled jobs tend to have higher earnings, which in turn can depend on a range of factors, including their level of education, English language proficiency, and motivations for migration.
In December 2025, the median earnings of people who had an EU or non-EU nationality when they first registered for a national insurance number were slightly higher than those of UK nationals (Figure 10). HMRC publish median earnings data for nationals of 48 countries, with the highest among nationals of English-speaking countries. Australian nationals’ annualised median earnings were £53,700, followed by New Zealanders (£51,900), Americans (£48,200), and Canadians (£48,100). The employee population of each of these groups is relatively small, however.
Focusing only on larger nationality groups – that is, those holding over 100,000 jobs – Irish employees had the highest median earnings, while Bangladeshi and Pakistani employees had the lowest (Figure 10). These differences by nationality will largely reflect different visa types and reasons for migration to the UK, with higher earnings among people arriving on skilled work visas and lower earnings among those arriving as refugees or partners of British residents. The relatively low earnings among Chinese nationals might result in part from the fact that many are in the UK on student visas—international students cannot work more than 20 hours per week.
Figure 10

Earnings data is also available for recent arrivals – that is, people who were issued an entry visa between April 2019 and March 2023 – including breakdowns by industry and occupation. In the 2023/24 financial year, the median earnings of Skilled Workers were £56,600, while Health and Care (H&C) workers earned £30,900. The partners of Skilled Workers and H&C workers had lower median earnings (£30,200 and £22,100, respectively). People granted family visas had the lowest median earnings in 2023/24, at £20,200.
Highly educated migrant workers are often overqualified for their jobs
Compared to UK-born individuals, migrants were more likely to work in jobs for which they are overqualified—i.e., their education level is above that typically required for the job. The indicator of overqualification used here shows the share of highly educated workers (those with university degrees or with higher education qualifications below degree level, such as nursing) working in low- and medium-low-skill jobs (Figure 11).
Only migrant workers born in North America, Oceania, and EU14 countries were less likely to be overqualified for their jobs than the UK-born in 2025. By contrast, workers born in South Asian countries (excluding India) were the most likely to be overqualified.
Some of the factors explaining migrants’ high over-qualification rates include employers’ failure to recognise foreign qualifications, migrants’ lack of information about the job searching process in the UK, or a lack of UK-specific skills, such as language ability.
Figure 11

Foreign-born workers were more likely to work during night shifts and in non-permanent jobs than the UK-born
Figure 12 compares UK- and non-UK-born employees’ working patterns and job contracts in 2025. In some cases, there was little difference between the two groups. For example, the share of workers in part-time jobs because they could not find a full-time job was relatively low for both the UK-born and migrants. Similarly, while migrant workers were more likely to be in non-permanent jobs or have a zero-hours contract, these shares were low. Around a third of migrants with zero-hours contracts in 2025 worked in social care or as wait staff or bar staff.
Figure 12

However, a quarter of non-UK-born employees worked in jobs involving some kind of shift work, compared to 17% of UK-born employees. Shift work is defined as work that takes place outside typical working hours (i.e., 9 am to 5 pm, from Monday to Friday. It is more common in sectors that require 24-hour service (e.g., nursing and care homes) or where service is concentrated at certain times of the day (e.g., restaurants, night clubs), and could involve working on different time schedules each day of the week, on weekends, on split shifts (e.g., full shifts divided into two distinct parts with a gap of several hours in between) or during night time.
In 2025, 10% of migrant employees worked night shifts, compared to 5% of UK-born employees. Night shift work is thought to negatively affect both physical and mental health and work performance through its impact on sleep and circadian rhythms.
Evidence gaps and limitations
Both the Annual Population Survey and HMRC PAYE RTI are cross-sectional datasets. As a result, we cannot follow individuals over time and, therefore, we do not know whether migrants’ labour market position has improved or worsened since their arrival to the UK. In general, migrants’ integration in the labour market is likely to improve the longer they stay in the UK. See the Migration Observatory commentary, Upward Mobility: Earnings trajectories for recent immigrants, for an in-depth discussion.
The aggregate occupational categories used in this briefing (e.g., ‘high-skilled’ or ‘low-skilled’) are also imperfect as a measure of occupational skills. While using aggregated occupational groups is useful for providing an overview of the skills required to perform a certain job, in practice, they can contain a wide range of occupations, including workers with quite different levels of education, pay or working conditions.
Acknowledgements
Thanks to Michael O’Connor for comments on a previous version of the briefing. This report was originally produced with the support of the Paul Hamlyn Foundation, and it was updated in 2022 and 2023 with the support of Trust for London.
-
Media Coverage