
-
Introduction
By Zachary Strain and Madeleine Sumption
Skilled migration is widely recognized as economically beneficial. Immigration policy in the UK, as in many other countries, is much more liberal if workers are coming to work in highly skilled jobs. However, skilled migration patterns vary depending on factors outside policymakers’ control, and not all parts of the UK are equally able to attract skilled workers from overseas. Drawing on data from Freedom of Information requests, this analysis examines which industries and regions or nations of the UK have been most attractive to people coming to the UK on Skilled Worker visas—the main route for newly hired migrants coming from overseas to work. It looks at data from the past decade, including during the pandemic and in the early months of the post-Brexit immigration system in 2021. Among the key findings:
- London has been the major destination for Skilled Work visa holders over the past decade. Several industries have played a role in attracting these overseas workers, but particularly finance and professional/scientific activities. Scotland also has a relatively broad base of industries using Skilled Worker visas, with an above-average share in the education sector.
- In the rest of the UK, a single industry has driven demand for overseas Skilled Workers: health. Outside of London, the health sector was responsible for as much as 60% of all certificates of sponsorship for work visas by 2020. In most parts of the UK, employers have attracted few workers in industries outside of health.
- In part because London makes broader use of the Skilled Worker visa route, Covid-19 pandemic affected demand for skilled work visas in the capital more than in other parts of the UK. London accounted for three quarters of the decline in Skilled Worker Certificates of Sponsorship in 2020. This is partly because overseas skilled workers in London are more likely to be coming for jobs in finance and professional or scientific activities, and visas in these industries across the UK fell most during the pandemic.
- As the new immigration system was implemented in the first half of 2021, few EU citizens used the Skilled Worker route. Those who did were much more likely to be sponsored by employers in London, compared to non-EU citizens. This is largely driven by the jobs they are working in: EU citizens were concentrated in finance, professional or scientific occupations, and education.
-
Understanding the Evidence
This briefing uses Freedom of Information (FOI) request data on the Skilled Worker route (previously known as Tier 2 general), which is the main employer-sponsored visa for recruiting newly hired employees to work in the UK. The data show numbers of Certificates of Sponsorship (CoS), which are assigned to migrants ahead of a work visa application or an application to extend an existing visa.
To understand trends in demand for new overseas workers, it is most useful to look at CoS for out-of-country visa applications because they respond more quickly to changes in policy or economic circumstances. However, due to a Home Office database problem in late 2019 and most of 2020, it was not possible to distinguish in-country and out-of-country applications during that period. Analysis of change over time including in 2019 and 2020—which makes up the bulk of the analysis in this briefing—must therefore rely on data that combine new applications and extensions.
Data for 2010-2018 and for 2021 do allow this distinction and are used in particular for examining the situation in 2021. Out-of-country data are more important in 2021 in particular because very few EU citizens will have applied for in-country extensions of existing visas so soon after the end of free movement. Note when reading the charts and tables that out-of-country CoS figures are not directly comparable to the combined data.
The CoS data come with some caveats. First, they do not tell us whether skilled migrants applying for work visas actually came to the UK. There is evidence that during the pandemic more people than usual failed to travel to the UK after receiving work visas (ONS, 2021). The CoS data thus give an indication of recruitment activity and potential demand for skilled non-EU workers, but are not a direct measure of migration to the UK.
Second, the migrant’s place of work may not always be recorded accurately (e.g. where an employer has more than one office in the UK), and some people work in more than one location. Third, the FOI data grouped together some regions that would normally be analyzed separately; for example, the Midlands and East of England appear as a single category; and the South West is combined with Wales. Finally, the figures are taken from an operational database, which means they can change over time and have not gone through the same quality assurance procedures as official statistics; the FOI data were also rounded to the nearest 5 applicants.
For simplicity, we use shortened names to refer to official industry groupings: “Finance” to refer to Financial and Insurance Activities; IT to refer to Information and Communications; “Professional/Scientific” to refer to Professional, Scientific and Technical Services; and “Health” to refer to Health and Social Work. Note that most social care positions were not eligible for skilled work visas during the period considered due to the skills and salary requirements.
For most of the period covered by this briefing, the visas we are considering were known as “Tier 2 (general)” visas. For simplicity, we refer to them using their current name, i.e. Skilled Worker visas. This includes the Health and Care subcategory of the Skilled Worker route.
We also use Annual Population Survey data to look at skilled migrants overall, including those who are not on work visas. The APS is based on an ONS survey of households across the UK Some people are excluded, such as residents of communal establishments like hostels. Response rates for the survey have declined over time, and were particularly low during the pandemic; this means that there is particular uncertainty about the reliability of the data for 2020.
-
Understanding the Policy
The Skilled Worker route is the main work visa designed to bring workers to the UK for long-term work in the UK. Known in the pre-2021 immigration system as Tier 2 (general), this visa has been the main focus of policy debates about work-related migration. Several other work-related visa routes exist, but they are either short-term temporary visas, or have very specific requirements that most workers do not meet (e.g. requirements to be working as an entrepreneur, or be considered a leader in one’s field).
To qualify for a Skilled Worker visa, the worker must secure a job offer with an employer who is a licensed sponsor, and who will pay at least the minimum salary required for the job. In 2021, this salary will generally exceed £25,600, depending on the job and the qualifications of the worker, as explained in more detail in the Migration Observatory’s Primer on the 2021 Points-Based Immigration System. This salary threshold is down from £30,000 for non-EU citizens applying for work visas under the pre-2021 immigration system, the period covered by most of this briefing. From January 2021, EU citizens also need work visas to come to the UK, and face the same rules as non-EU citizens.
Which parts of the UK to Skilled Workers go to?
The Skilled Worker route makes up a small share of all visas issued, but is important from a policy perspective because it is expected to be one of the immigration routes with the most significant economic benefits. This is because there is evidence that skilled workers are most likely to contribute to productivity and public finances (MAC, 2012). It is also the only route through which most employers can sponsor workers from overseas to fill a UK-based vacancy.
Eligibility criteria for Skilled Workers are the same across all of the UK. However, this does not mean that Skilled Workers sponsored by UK employers will be evenly distributed across the country. Where people go depends both on employer demand and on the location’s attractiveness to overseas skilled workers.
Some parts of the UK have explicit strategies to attract skilled workers from overseas. The Scottish government, for example, has made “talent attraction and retention” an objective of Scottish government policy. When Boris Johnson was Mayor of London, he argued that there should be a ‘London visa’ to attract people to the capital, and the current London mayor, Sadiq Khan, has proposed devolved immigration powers for London and other cities.
London’s attractiveness to skilled migrants
London has for some time been a major destination for skilled workers, whether on the Skilled Worker route or entering the UK through other means. By 2020, London was home to 15% of all people in employment (including the UK born), but had attracted an estimated 40% of non-UK born workers in the highest-skilled jobs (Table 1). London’s employers are also more reliant on foreign-born workers than those in the rest of the country. In 2020, 28% of workers in highly skilled jobs in London were born abroad, compared to only 15% in the rest of the UK (see also Appendix Table 1).
Table 1
Non-UK born workers by job skill classification, 2020
| What share of foreign-born workers live in London? | |||||
| Place of birth | High skill | Medium-high | Medium-low | Low skill | Total |
| Non-EU | 42% | 43% | 40% | 36% | 41% |
| EU | 36% | 35% | 22% | 20% | 29% |
| All non-UK | 40% | 40% | 33% | 28% | 36% |
| UK | 14% | 10% | 7% | 5% | 10% |
| Total | 19% | 15% | 11% | 10% | 15% |
| What share of London's workers are foreign born? | |||||
| Place of birth | High skill | Medium-high | Medium-low | Low skill | Total |
| Non-EU | 28% | 26% | 37% | 42% | 31% |
| EU | 14% | 16% | 13% | 22% | 14% |
| All non-UK | 42% | 41% | 50% | 64% | 45% |
| UK | 58% | 59% | 50% | 36% | 55% |
| Total | 100% | 100% | 100% | 100% | 100% |
London has been similarly dominant in the Skilled Worker route. For most of the 2010s, the lion’s share of certificates of sponsorship for Skilled Worker visas went to workers planning to work in London. In 2014 and 2015, London employers assigned as many CoS to skilled non-EU workers as employers in the rest of the UK combined.
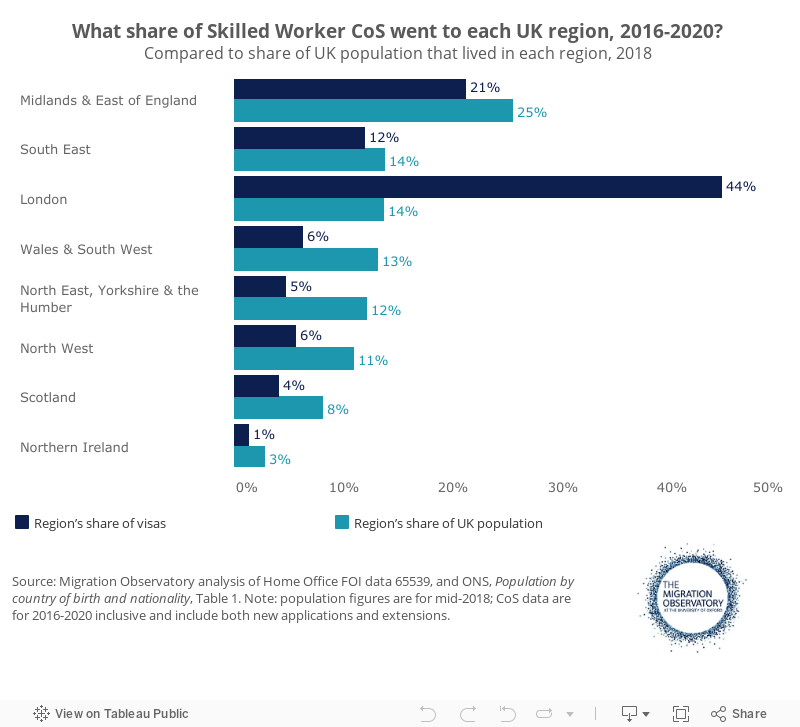
Figure 1 shows large differences in the extent to which different parts of the UK attract Skilled Work visa holders. From 2016 to 2020, London was the destination for 44% of workers with Certificates of Sponsorship, but had only 14% of the UK’s population. In the South East, the share of CoS was only slightly below the region’s share of the region’s population. Other region groupings were significantly underrepresented in the skilled worker CoS figures.
Figure 1
While it is natural to assume that London’s dominance in the skilled visa market results from higher salaries in the capital that make it easier for workers and employers to meet salary thresholds, an analysis from the Migration Advisory Committee (2019) suggested that this is not the case. The analysis found that skilled work visa holders were still strongly concentrated in London even after controlling for salary, industry composition, employer size, and workers’ age and gender. It concluded that the reason there are more skilled work visa holders in London may simply reflect non-EU migrants’ preference to live in London—i.e. that the attractiveness of different parts of the UK was a key determining factor.
The attitudes of employers may also play a role—for example, employers in London may be more willing to consider overseas job candidates if they have more experience working with migrants and/or are already familiar with overseas qualifications. In 2019, employers in London were more likely than those in any other region to say that they had recruited, or tried to recruit, non-UK nationals in order to fill hard-to-fill vacancies, according to the Employer Skills Survey (DFE, 2020): 52% said they had done this, compared to 35% for employers in the rest of the UK.
It is likely that the costs and bureaucracy of sponsoring skilled workers from overseas also play a role in employer’ willingness to engage with the immigration system (APPG on Migration, 2021). Most employers are not licensed sponsors and will have no experience of sponsoring overseas workers through the immigration system (Sumption and Fernandez Reino, 2018).
Which jobs draw overseas workers to London vs. the rest of the UK?
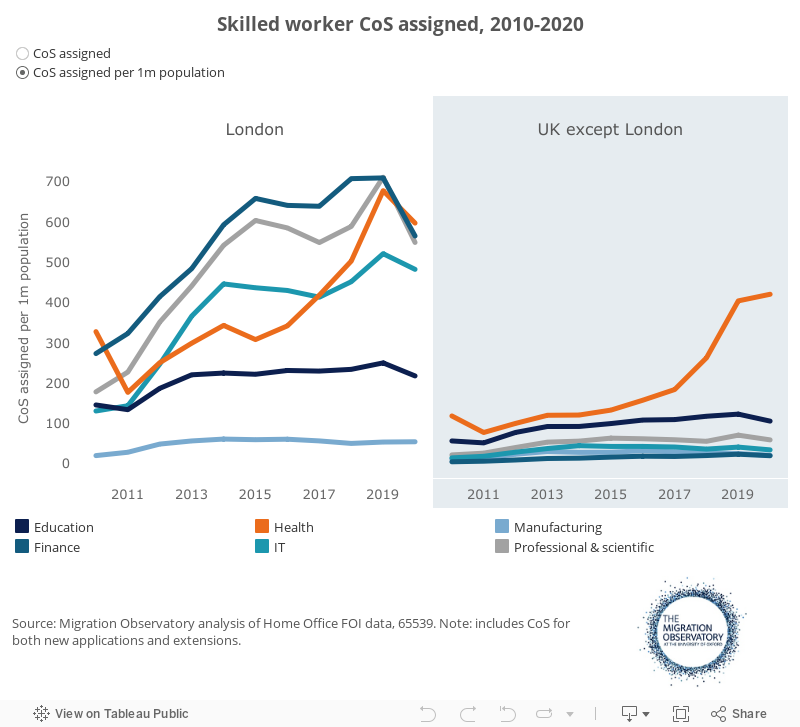
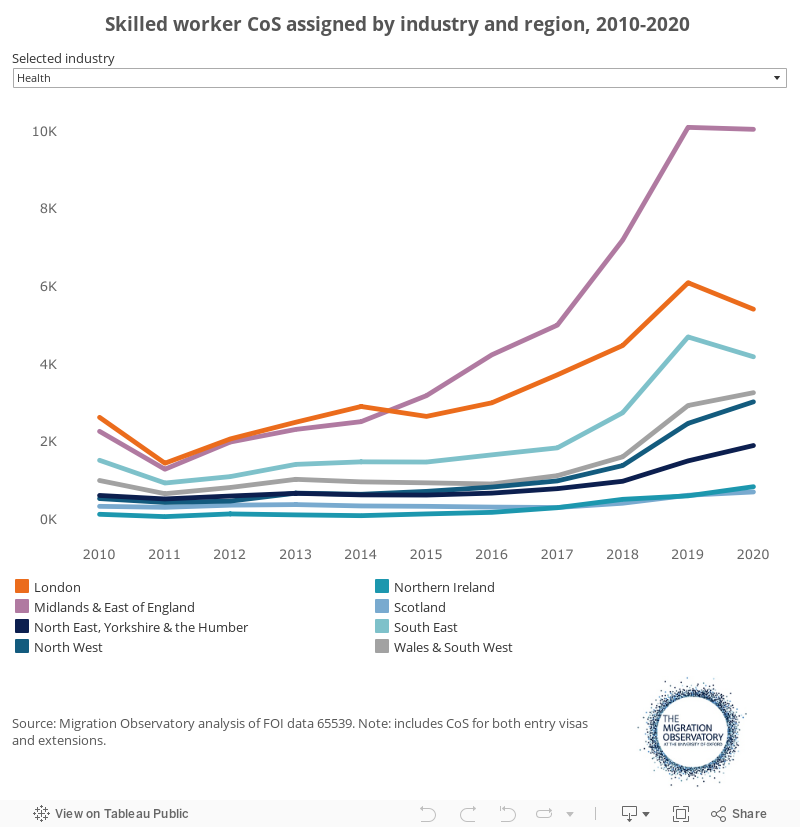
London employers use skilled work visas across a range of industries, most notably finance, professional or scientific activities, IT, and—particularly since 2016—health. Demand for skilled workers grew rapidly as the UK recovered from the global financial crisis in the 2011-2014 period. From 2015, growth in the Skilled Worker route in most of the top industries, except health, started to level off (Figure 2).
The picture in the rest of the UK is quite different. Outside of London, a single sector dominates: healthcare.
Figure 2
Why are there so many Skilled Worker visas in the health sector?
While London draws in Skilled Workers to a range of different services industries, demand in most of the rest of the UK has increasingly been driven by the health sector.
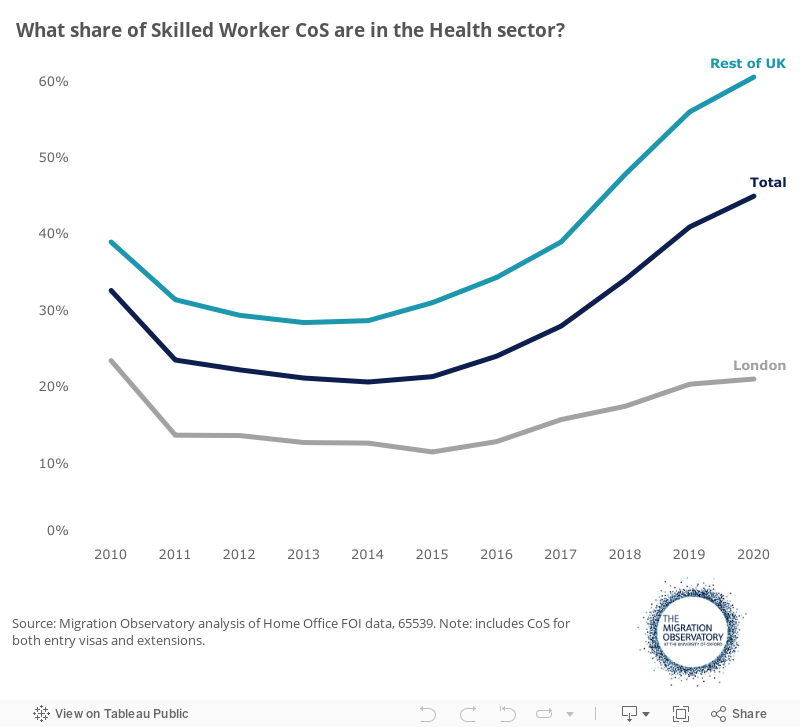
At its low point in 2014, the health sector made up 20% of Skilled Worker CoS across the UK as a whole (Figure 3). Demand for healthcare workers increased throughout the 2010s, however, and particularly in 2018 and 2019. During the pandemic in 2020, the health sector was the only major industry in which the number of skilled work Certificates of Sponsorship did not contract. By 2020, the health sector’s share of all CoS had reached 45%, including extensions. The figures are even starker if we only consider out-of-country CoS, for which 2019-20 data are not available. Those figures show that the share of CoS assigned to health workers rose from 18% in 2014 to 40% in 2018, and 50% in the first half of 2021 (Appendix table 2).
There are various explanations for this increase. A sharp decline in the number of EU nurses registering in the UK took place after the introduction of new language requirements and the EU referendum result in 2016. This is likely to have been a factor behind higher recruitment of non-EU nurses after 2016 (Health Foundation, 2020). There were also persistent concerns about shortages of NHS staff during this period (Ibid). At the same time, rising overseas recruitment was possible as a result of the removal of doctors and nurses from the cap on Skilled Worker visas that was in place from 2011 to 2020 (this cap was removed entirely in January 2021 under the post-Brexit immigration system). Many NHS Trusts have explicit programmes for recruiting overseas health professionals, particularly nurses who make up the majority of Skilled Workers in the health sector (MAC, 2016).
Growth in health sector CoS was strongest outside of London. By 2020, CoS for healthcare roles had become so significant outside of London that they accounted for as much as 60% of demand for Skilled Workers, compared to only 21% in London (Figure 3).
Scotland was the only other exception, where the health sector made up only 26% of CoS in 2020. In every other region, health made up a majority of CoS in 2020. (Note that some regions are grouped together, as explained above in Understanding the Evidence.) In Northern Ireland, health made up almost three quarters (73%) of CoS in 2020.
Figure 3
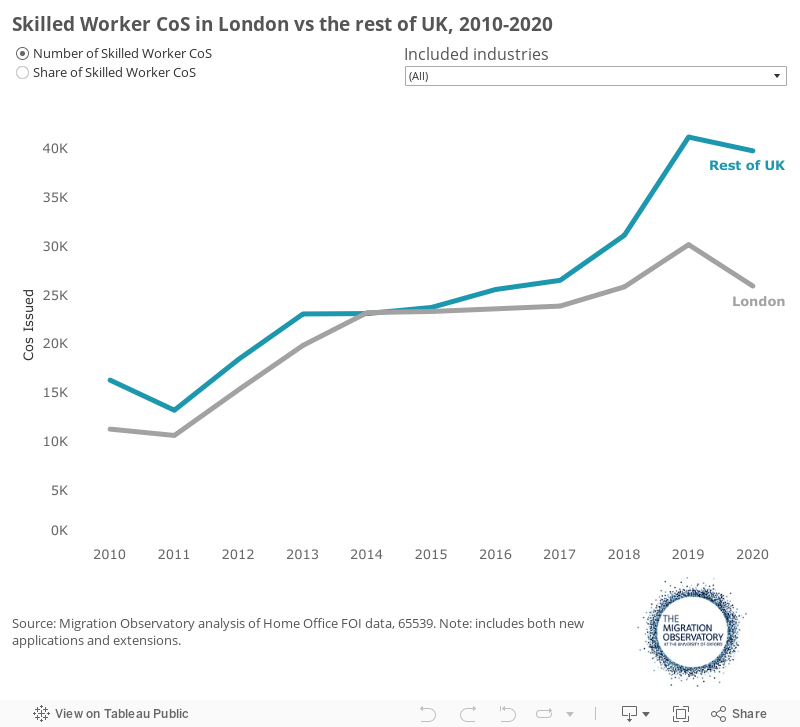
One consequence of growing recruitment into the health sector is that London’s share of Skilled Worker certificates of sponsorship fell from a peak of just over 50% in 2014, to 39% in 2020—the lowest share since the beginning of the data series in 2010 (Figure 4). If we remove the health sector, however, London’s share of Skilled Worker CoS has actually been stable at around 55% to 57% since 2014. On average from 2010 to 2020, London employers attracted 87% of Skilled Workers with certificates of sponsorship in the finance industry, 64% in IT, and 60% in professional/scientific activities, compared to “only” 24% in the health sector.
Figure 4
Different regions’ Skilled Worker recruitment activity relative to the size of their populations varies, both overall and by industry. In the health sector, the areas where employers assigned the highest number of CoS were London, followed by the Midlands/East and the South East, with Northern Ireland not far behind. Excluding healthcare, London and the South East remain at the top of the table but are followed by Scotland, where employers attracted Skilled Workers in a range of occupations, particularly education (Table 2; see also Appendix Figure 1 for the full dataset).
Table 2
Annual average CoS assigned per 100,000 population, 2016-2020
| All | Health | Other industries | |
|---|---|---|---|
| London | 290 | 51 | 239 |
| South East | 78 | 33 | 44 |
| Midlands & East of England | 75 | 44 | 31 |
| North West | 47 | 24 | 23 |
| Scotland | 45 | 8 | 36 |
| Northern Ireland | 44 | 25 | 19 |
| Wales & South West | 43 | 23 | 21 |
| North East, Yorkshire & the Humber | 35 | 14 | 20 |
Which employers recruited non-UK Skilled Workers during the pandemic?
The number of Skilled Work visas grew steadily from 2011 to 2019, when it peaked at just under 37,000 main applicants granted entry visas—the step that follows the CoS applications analysed in this briefing. During the pandemic, however, skilled work visa grants fell by 8,000 or 22%, as discussed further in the Migration Observatory briefing, Work visas and migrant workers in the UK.
Demand for skilled work visas was much more affected by the pandemic in London than in the rest of the UK. As explained in the Understanding the Evidence section above, the Certificates of Sponsorship data used in this report (which allow us to distinguish different industries and different parts of the UK), understate the 2020 decline because they include visa extensions for people already in the UK, which did not fall much during the pandemic. Nonetheless they provide a useful indication of the direction of travel.
Three quarters of the decline in demand for Skilled Workers took place in London, where the number of CoS used fell by 14%. In other words, London was much more exposed to the reduction in skilled worker demand in 2020, in large part because most of the workers it attracts are in finance, IT and professional or scientific activities.
Outside of London and the South East, the next largest decline was in Scotland—another area that makes relatively broad use of Skilled Worker visas in sectors other than health. Scotland was the only other part of the UK where the health sector made up a similarly small share of visas as in London (17% on average from 2010 to 2020, compared to 16% in London). In Scotland, the education sector has traditionally made up a substantial share of visas, as has the finance industry (see Appendix Figure 1).
Figure 5
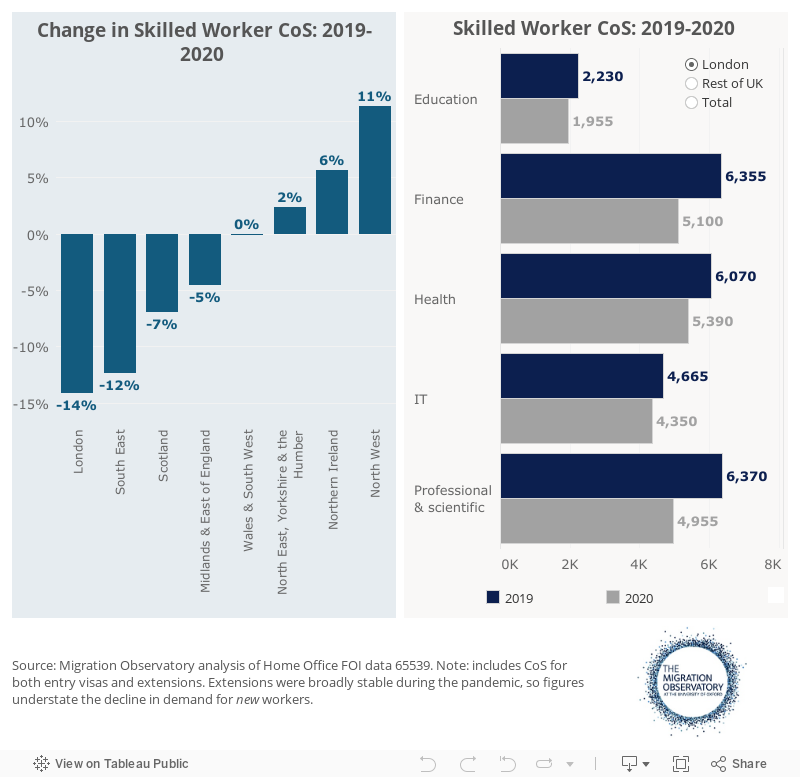
The decreases in skilled worker CoS in London in 2020 took place across all the major industry groups, including health, finance, IT and professional or scientific activities. These figures are consistent with the bigger picture of declining migrant employment across the board (and not just in the Skilled Worker route) in London. Separate data show that London saw the largest decline in EU migrants’ employment in 2020, for example—as outlined in the Migration Observatory briefing, Work visas and migrant workers in the UK.
In summary, London CoS were particularly affected by the pandemic, because the capital has traditionally attracted skilled overseas workers across a broader range of industries than most of the rest of the UK. However, it still remained a relatively attractive destination, with 39% of CoS in 2020—well above its 14% share of the population.
Who is using the post-Brexit immigration system, and where?
From January 2021, free movement ended and the new immigration system was introduced. Under the new system, EU citizens must also qualify for visas if they want to live and work in the UK. For more details on work visas under the new immigration system, see the Migration Observatory briefing, Work visas and migrant workers in the UK.
While the post-Brexit immigration system was designed to reduce EU migration into jobs that are classified as low-skilled, the UK government has said that it wants to continue to attract the highly skilled. One uncertainty about the post-Brexit immigration system is to what extent it would deter skilled EU workers from coming to the UK, for example as a result of increased bureaucracy and less attractive immigration status.
It is still too early to understand how the new immigration system is affecting skilled EU migration, because the system was introduced in the middle of the Covid-19 pandemic when many people did not want to move and employers were not hiring in large numbers. It may also take some time for employers to adjust to the new rules (including applying for sponsor licenses, a process that can take several weeks). Nonetheless, we can get an early indication of how EU citizens are using the system and what this means for different parts of the country, using data from the first half of 2021. These data point to two main conclusions.
First, very few EU citizens applied for work visas in the first half of the year. A total of just over 3,800 EU citizens applied for Skilled Worker visas from January to June 2021, making up 8% of all applications in the route, including dependents (Immigration Statistics Table Vis_D01). For more detail on these figures, see the Migration Observatory briefing Work visas and Migrant Workers in the UK.
Second, for those EU citizens who did come to the UK during this time, London has been the major draw. In the first half of the year, 60% of all certificates of sponsorship for EU skilled workers were assigned to people planning to work in London (Figure 6). This is much higher than for non-EU citizens, 35% of whom were planning to work in London.
Figure 6
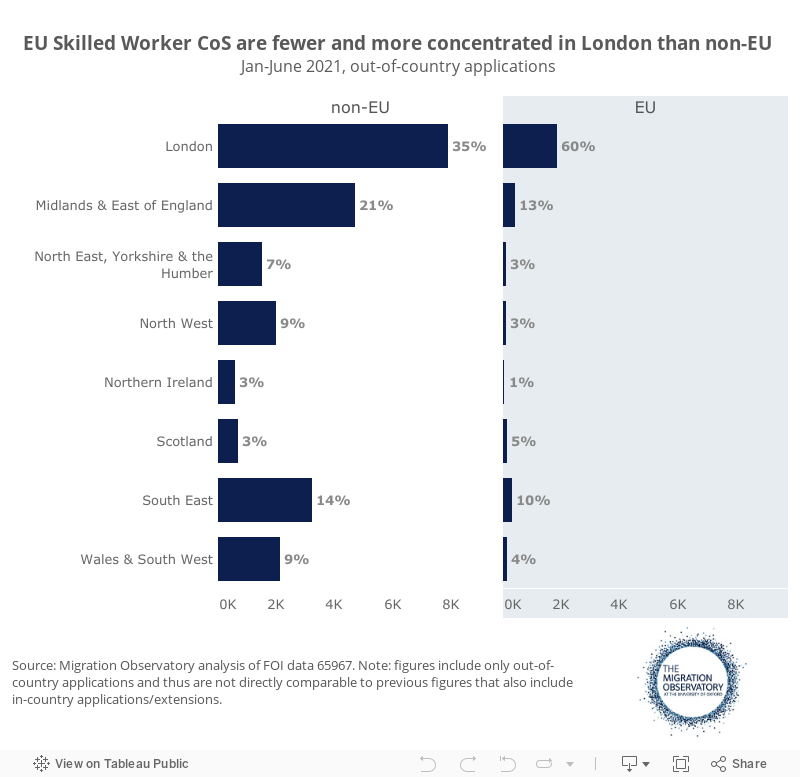
One reason that EU citizens with CoS in the first half of 2021 were concentrated in London is that they tended to work in different industries compared to non-EU citizens. In particular, 42% of EU citizens with CoS in 2021 were in the finance and professional or scientific industries, compared to 18% of non-EU citizens. As noted earlier, demand for Skilled Workers in these industries is usually concentrated in London. By contrast, only 10% of EU citizens’ CoS were in the health sector, compared to 55% of non-EU citizens.
One factor behind the high share of EU skilled workers being recruited in London may be that London employers already have more experience sponsoring overseas workers, due to the high share of non-EU skilled workers who have worked there over the past decade. Employers who are more familiar with the visa system may be more willing to use it for EU citizens, and less deterred by the administrative costs of sponsorship.
Although London has received a higher share of EU citizens than the rest of the UK, their numbers are not big enough to shift the overall balance back towards London. In the first half of 2021, 38% of all out-of-country CoS were for employers based in London, a share that remains low in comparison to the mid-2010s (the 2014 peak for out-of-country CoS was 56%). However, there could be a meaningful impact on the overall distribution again if recruitment activity in the industries where EU citizens have been concentrated, such as finance, increases in coming years.
And even though London has attracted the majority of EU skilled workers under the post-Brexit immigration system, it is still the part of the UK that is most exposed to the end of free movement. This is because many jobs are not eligible for work visas at all under the new immigration system, and London is the part of the UK with the highest share of the overall population born in EU countries (Kone, 2018).
Conclusion
Certificates of Sponsorship numbers result from a combination of employer demand and workers’ choices about which jobs to apply to. They thus provide an indication of different parts of the UK’s attractiveness for skilled workers—albeit only to the extent that those places have jobs available for skilled workers to apply to and employers who are willing and able to use the visa system to sponsor them. Indeed, employers in some parts of the country, particularly London, will have more experience with foreign-born job applicants because they make up a higher share of the population there, and some will also have more experience of using the immigration system to sponsor skilled workers.
Now that the cap on skilled worker visas has been removed, the immigration system does not put different parts of the UK in competition with each other for skilled workers. An additional worker in London does not necessarily mean there must be one fewer in Scotland, for example.
However, an uneven distribution may indicate that not all parts of the UK are benefiting from the Skilled Worker route in the same way. Outside of healthcare, London has attracted the majority of overseas Skilled Workers, including in high-wage industries such as finance and IT. After London, recruitment of overseas workers per capita of the region’s population was highest in the South East and Midlands/East of England for health workers, and in the South East and Scotland for industries other than health.
On the other hand, the data suggest that although London’s employers still sponsored many health professionals, the capital may be relatively less attractive to these workers because the jobs command lower pay than many other professional roles that are eligible for the Skilled Worker route. London’s high cost of living is not fully compensated for by London pay uplift (Hirsch, 2016).
Finally, early data suggest that after the 2020 pandemic-driven decline, skilled worker visas returned to pre-pandemic levels, but that this was driven largely by the health sector. Recruitment in other major industries remained subdued, and this had the largest impacts on London. It remains to be seen how quickly the capital will bounce back, and whether increased levels of remote working will affect skilled migration to the capital in the longer term. London and the South East have a higher share of jobs that can be done from home, according to ONS analysis, and finance and IT occupations—which are major recruiters of non-UK Skilled Workers—were among the occupations most amenable to home working. Nonetheless, even despite the pandemic, London remained the top destination within the UK.
Appendix Table 1
Workers by place of birth and job skill classification
| Workers in London by place of birth and job skill classification | |||||
| High skill | Medium-high | Medium-low | Low | Total | |
| Non-EU | 533,000 | 350,000 | 432,000 | 132,000 | 1,447,000 |
| EU | 255,000 | 210,000 | 148,000 | 67,000 | 681,000 |
| All non-UK | 788,000 | 560,000 | 581,000 | 199,000 | 2,128,000 |
| UK | 1,097,000 | 790,000 | 589,000 | 112,000 | 2,588,000 |
| Total | 1,884,000 | 1,350,000 | 1,170,000 | 311,000 | 4,716,000 |
| Workers in the UK by place of birth and job skill classification | |||||
| High skill | Medium-high | Medium-low | Low | Total | |
| Non-EU | 1,277,000 | 808,000 | 1,091,000 | 364,000 | 3,539,000 |
| EU | 701,000 | 602,000 | 690,000 | 338,000 | 2,331,000 |
| All non-UK | 1,978,000 | 1,410,000 | 1,781,000 | 701,000 | 5,870,000 |
| UK | 7,996,000 | 7,592,000 | 8,497,000 | 2,335,000 | 26,421,000 |
| Total | 9,975,000 | 9,002,000 | 10,278,000 | 3,036,000 | 32,291,000 |
|---|---|---|---|---|---|
Appendix Table 2
Out-of-Country CoS assigned by industry, 2010-2018 and Jan-June 2021
| 2010 | 2011 | 2012 | 2013 | 2014 | 2015 | 2016 | 2017 | 2018 | 2019 | 2020 | 2021 Jan-June | |
|---|---|---|---|---|---|---|---|---|---|---|---|---|
| Health sector | 2,387 | 1,447 | 1,532 | 1,797 | 2,810 | 3,205 | 4,915 | 6,020 | 10,025 | n/a | n/a | 12,915 |
| Other sectors | 7,797 | 6,735 | 8,119 | 10,303 | 12,897 | 13,807 | 13,550 | 13,388 | 15,198 | n/a | n/a | 12,975 |
| All sectors | 10,184 | 8,182 | 9,651 | 12,100 | 15,707 | 17,012 | 18,465 | 19,408 | 25,223 | n/a | n/a | 25,890 |
| Health sector share | 23% | 18% | 16% | 15% | 18% | 19% | 27% | 31% | 40% | n/a | n/a | 50% |
Appendix Figure 1
Acknowledgements
Thanks to Sophia Wolpers from London First and Chris Rocks from the GLA for comments on an earlier draft, and to Hector Hurmuz Sklias for help with the visualisations. This analysis was produced with the support of Trust for London. The Trust is one of the largest independent charitable foundations in London and supports work which tackles poverty and inequality in the capital. More details at www.trustforlondon.org.uk.
References
- APPG on Migration. 2021. The Impact of the New Immigration Rules on Employers in the UK. Available online.
- DFE. 2020. Employer skills survey 2019: England results. London: Department for Education. Available online.
- Health Foundation. Thinking local and global: exploring the UK’s reliance on international nurses and the impact of Covid-19. Available online.
- Hirsch, D. (2016). London Weighting and London Costs – A Fresh Approach? London: Trust for London. Available online.
- Migration Advisory Committee. (2012). Analysis of the impacts of migration. Available online.
- Migration Advisory Committee. (2016). Partial review of the shortage occupation list: nursing. Available online.
- Migration Advisory Committee. (2019). Full review of the shortage occupation list. Available online.
- ONS. 2021. Using statistical modelling to estimate UK international migration. Newport: ONS. Available online.
- Sumption, M. and Fernandez Reino, M. 2018. Exploiting the Opportunity: Migrants in low-skilled work after Brexit. Oxford: Migration Observatory. Available online.