The data on this page are superseded by the new ONS population data for 2014, available from August 27th 2015. Please visit this page for official 2014 estimates of the foreign-born population.
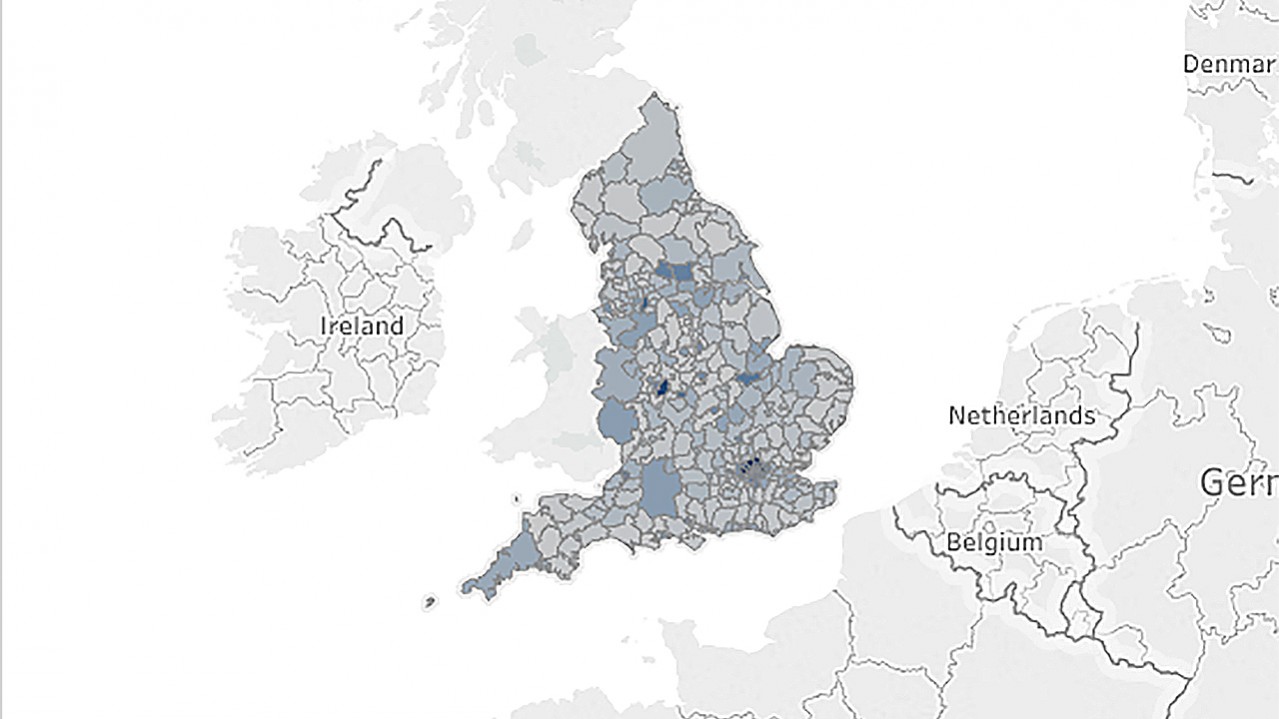
This map and table show the projected number of new EU-born residents across local areas of England in 2014 by country of birth. It was created using a Migration Observatory methodology enabling the extrapolation or projection of detailed local data on immigration in England for 2014. The figures for 2014 are not official statistics from the Office for National Statistics (ONS) and only intend to provide an idea of the likely number of foreign-born residents in different local areas of England as of 2014. The limitations are explained in more detail here.
Note: Darker shades show higher number of migrants, lighter shades show lower number. Hovering over or clicking on a local area will show the Census and extrapolation figures.
Table – EU born residents
| Region | EU-born 2011 Census | EU-born 2014 extrapolation | 2014-2011 difference | 2014-2011 % difference |
|---|---|---|---|---|
| East | 213000 | 238,000 | 25,000 | 12% |
| East Midlands | 140000 | 154,000 | 14,000 | 10% |
| London | 711000 | 872,000 | 161,000 | 23% |
| North East | 36000 | 52,000 | 16,000 | 44% |
| North West | 144000 | 185,000 | 41,000 | 28% |
| South East | 319000 | 359,000 | 40,000 | 13% |
| South West | 1510000 | 160,000 | 9,000 | 6% |
| West Midlands | 136000 | 169,000 | 33,000 | 24% |
| Yorkshire and the Humber | 131000 | 158,000 | 27,000 | 21% |
| Average across regions | 41000 | 20% | ||
| England | 1981000 | 2,347,000 | 366,000 | 18% |
Shows the projected number of new EU residents across local areas of England in 2014 by country of birth.


