
The effects of the Covid-19 pandemic are visible across the whole of society, and migration is no exception. From late March 2020, restrictions on travel, the closure of visa centres, and economic turmoil have had huge impacts on the immigration system. Following a large decline in international travel after the first UK lockdown, passenger numbers remained well below recent averages throughout the year. Grants of visas in categories across the immigration system also dropped in 2020.
One of the major questions facing migration researchers and policymakers currently is what this all means for migration patterns overall. How much lower is migration because of the pandemic? Who is still coming to the UK and who is not? Who is leaving? Is the migrant population declining?
The main source of data used to measure immigration and emigration flows—the International Passenger Survey—has been suspended due to the pandemic. As a result, recent attempts to examine how the migrant population is changing have used population survey data, which does not give a direct measure migration flows but does give some insight into the migrant population and how it is changing.
This commentary examines what we know from currently available data about how the total size of the migrant population has changed in 2020, and concludes:
- Headline data from the Labour Force Survey (LFS) suggest that the number of migrants living in the UK fell in 2020. In Q3 2020, the estimated foreign-born population was 8.3 million, down from 9.2 million in the same quarter a year earlier. This is a decline of 894,000 or 10%. However, there is enormous uncertainty about these estimates and compelling reasons to believe that they are not accurate.
- Estimates of the migrant population are based on pre-pandemic projections of the total UK population that are likely to be too high. During the pandemic, the UK population may have declined, but this is not factored in to estimates of the migrant population. All else equal, this would mean that the official figures underestimated the decline in the foreign-born population. But all else is not equal.
- When the pandemic hit, ONS switched to a socially distanced method of recruiting people into statistical surveys, and this appears to have disproportionately affected migrants’ participation. If migrants are less likely to participate than non-migrants with the new method of data collection, this means their numbers will be underestimated.
- When we look at data on people recruited into the survey before the pandemic but surveyed in mid-2020, there is still a considerable decline in the migrant share of the UK’s population (e.g. due to emigration), particularly in London. But it is smaller than the headline figures suggest.
- All this creates significant uncertainty and means that we should be cautious when comparing data from 2019 and 2020. Some of the changes we see will be real but some will be due to new biases in the data caused by the pandemic.
The demise of the data
Covid-19 has seriously affected migration data. This means that many of the key questions that we are accustomed to being able to answer about the nature and scale of migration to the UK are now more uncertain.
First, the International Passenger Survey, which the Office for National Statistics (ONS) previously used to examine immigration, emigration and net migration, was suspended in March 2020 because of the difficulty collecting data through face-to-face interactions at ports and airports during the pandemic. While this survey had many flaws (including a likely overestimate of non-EU net migration and an underestimate of EU net migration), its disappearance leaves us without an alternative set of data measuring overall UK migration flows. ONS had already planned to move away from the IPS when measuring migration, and is currently working on a replacement data source that will draw on administrative records (e.g. tax and benefits payments) instead, but this will not be ready until later this year at the earliest.
Before the pandemic, National Insurance Number (NINo) registration data also used to provide some insight into migration patterns. (Again, there were many limitations, including the fact that people who are not working will not necessarily apply for a NINo, and that some migrants entering the country live here for much longer than others before applying.) However, this data source also became much less useful in 2020, because the issuance of NINos was disrupted by Covid and new registrations for EU citizens have been suspended.
Population data from the Labour Force Survey
In the meantime, we do still have another data source that is often used for examining the migrant population: the Labour Force Survey. This ONS survey continues to collect data from households around the UK about the composition of the current population. A variant of the dataset with some additional respondents (known as the Annual Population Survey [APS]) is used to produce regular estimates of the total migrant population of the UK, by country of birth and nationality. Historically, the LFS/APS has been one of the most important sources of data for research on migration, though it has limitations too.
In theory, the data can be used to track rises or falls in the migrant population over time. It does not provide a direct measure of migration and excludes people in communal establishments, which are not included in the survey, and has also underrepresented newly arrived migrants. However, over the long run it should give some insight into the impact of migration on the migrant population. If, for example, Covid-19 caused a big decrease in immigration and an increase in emigration, we should expect to see changes in the migrant population living in the UK too.
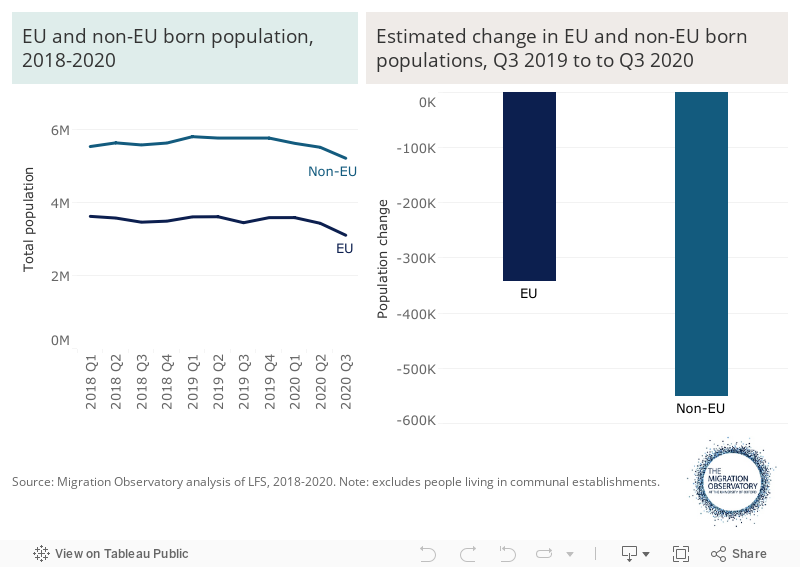
Headline LFS data for the first three quarters of 2020 do in fact show a big decline in the estimated migrant population in 2020. In Q3 2020, the estimated foreign-born population was 8.3 million, down from 9.2 million in the same quarter a year earlier. This is a decline of 894,000 or 10%.
Figure 1
So have close to one million migrants really emigrated? Unfortunately, it is very difficult to say.
This is because we know that the pandemic caused serious problems in the collection of data, and it is possible that these have particularly affected data on migrants.
There are two main ingredients in the estimate of the migrant population, both of which are creating uncertainty:
- The LFS/APS data: this is used to calculate the share of the population that is foreign born or UK born.
- ONS projections for the size of the population: these are needed to translate information on characteristics of people in the LFS/APS into absolute numbers of people.
Uncertainty about the size of the UK’s population
The LFS only tells us the share of the population that has a particular characteristic, like being born abroad. It does not tell us how big the population is. Usually, assumptions about the total population are based on population projections, which are set out in advance and do not account for short-term shocks like a pandemic. The LFS methodology assumes that the total population of the UK increased by around 370,000 in the year ending Q3 2020. This is based on the annual population growth estimated by the ONS, which is accurate under normal circumstances. However, if the total population had changed – e.g. due to large-scale emigration or excess deaths – this would not be reflected in the figures. In other words, the LFS-based estimates are based on the (surely incorrect) assumption that the UK’s population continued to grow in 2020 in the same way it had done in previous years.
A consequence of this is that when the estimated share of the UK population that was born abroad declined in 2020, this mechanically led to an estimated 1.25m increase in the estimated number of UK-born people living in the UK (Figure 2). In practice, this is not plausible. It cannot be explained by births and deaths (births are relatively constant over time and deaths went up in 2020). It is unlikely to be explained by overseas-resident Brits returning home: LFS data suggest that, at least in Q2 2020, the number of Brits who had been living overseas a year earlier was only 79,000 – similar to the figure in previous years.
Figure 2
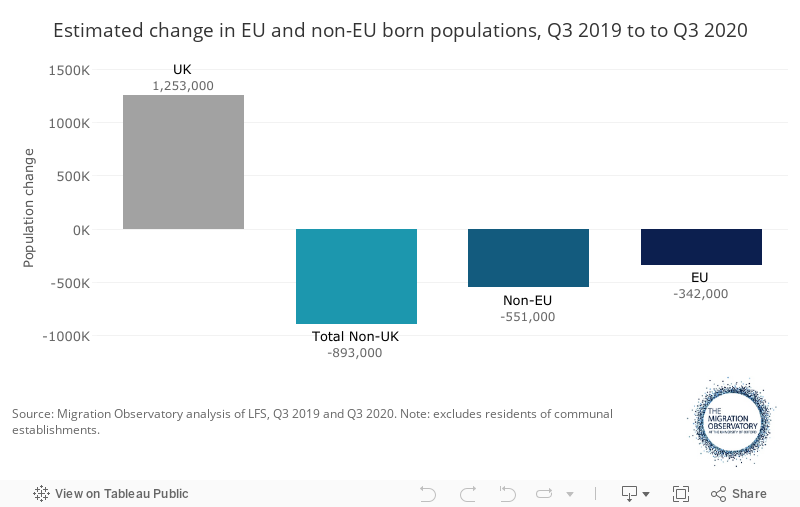
As Jonathan Portes and Michael O’Connor have pointed out in separate analysis, we can adjust the data so that the UK-born population is held at a plausible level and the total estimated UK population is adjusted downwards to account for likely emigration. Doing this means that the estimated decline in the migrant population is even larger than 894,000. Their calculations put the adjusted figure at just under 1.3m.
However, there is something else going on in the data that changes the picture, and works in the opposite direction.
Changes in data collection methods may disproportionately affect migrants
As a result of the pandemic, ONS changed the way it contacts people to participate in the LFS. Both pre- and post-pandemic, respondents were sent letters telling them they had been selected into the sample. Where previously interviewers would knock on the door in person for a face-to-face first interview (there are five interviews in total), instead respondents had to get in touch to provide their phone number. If they did not, ONS could chase them up if they could obtain their phone number from other sources, but in many cases this is not possible.
This change in recruitment method was followed by a big drop in response rates, particularly among people living in rented accommodation (rather than owner-occupied homes). This is a problem because it introduces new bias into the estimates (e.g. if renters are less likely to participate, we will underestimate the number of renters in the UK). To address this, ONS adjusted the weights that are used to analyse the data, so that the share of the population living in different accommodation types remained constant. As ONS has pointed out, this is a temporary and imperfect solution to the problem and does not address the risk of bias resulting from other groups of people who might have become less likely to respond to the survey, including migrants.
It is possible that migrants were disproportionately affected by the change in the way survey respondents were recruited (the move to telephone contact) and therefore that some of what we saw in 2020 is an increase in migrants not participating in the survey, rather than just emigration.
Existing research shows that survey response rates are often lower for migrants, and are affected by factors like language proficiency, trust and survey data collection methods. In the UK case, migrants may have been less likely to get in touch with ONS to participate in the survey, or less likely to have a landline allowing ONS to chase up non-responders.
Without another data source to check the figures against, there is no hard and fast way to identify how much of the apparent decrease in the foreign-born population is due to emigration and how much is due to migrants not responding to the survey. However, there are some clues in the data that suggest that some of what we are seeing is a statistical rather than a real change.
Some indications that the drop in the migrant population may be smaller than the headline figures suggest
Survey participants remain in the LFS for five quarters, unless they move house, emigrate or decide to drop out. In the summer of 2020 (Q3), some of the LFS respondents were people who were recruited into the survey before the pandemic, under the old, face-to-face method; some were people who had been selected under the new, socially distanced method.
Figure 3 shows the estimated share of the population from 2018 to 2020 based on different groups of respondents. The purple line shows only those who are in their third, fourth or fifth wave of the survey; the large majority of these people will not have been affected by the change in selection method in 2020, because they were recruited by the end of March 2020. The blue line shows the share estimated using only the first and second waves of the survey. By Q3 2020, all of this group would have been recruited using the new method.
The figures are presented as percentages rather than absolute numbers, to avoid the problem that we do not have a reliable estimate for the UK population in 2020.
Figure 3
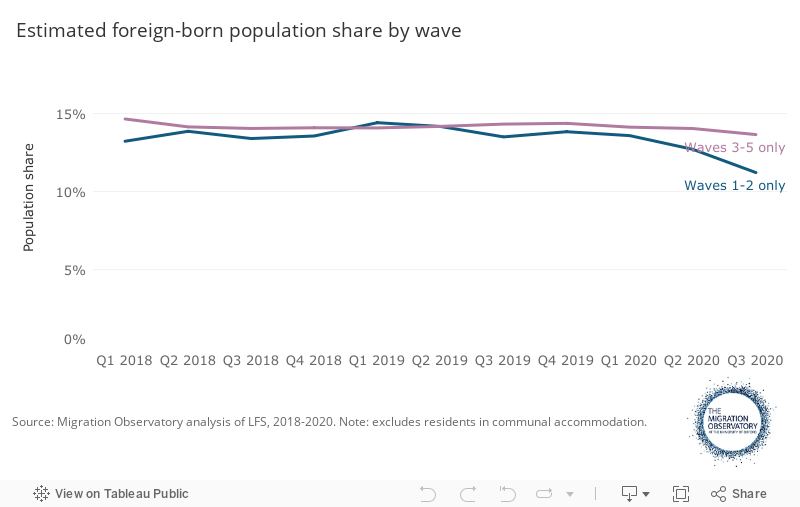
Normally, the estimated migrant share of the population is quite similar regardless of whether we look at waves 1-2 or waves 3-5. (In recent years it has actually been slightly higher on average for waves 3-5, with UK-born respondents more likely to drop out of the survey between waves.) However, the two lines diverge substantially in 2020. In other words, the recent decline in the estimated foreign-born population share is larger among people recruited under the new method.
When we look at all waves of data, the foreign-born share of the population falls by 1.4 percentage points from Q3 2019 to Q3 2020, from 13.9% to 12.5%. For respondents recruited under the new system, however, the estimated migrant share fell from 13.5% to 11.2% (2.3 percentage points). Among people recruited under the old method, the decline was smaller: 14.3% to 13.7% or 0.7 percentage points.
The potential impact of migrant non-response outweighs the effect of uncertainty about the population discussed above. As a back-of-the envelope calculation, Table 1 shows what happens if we assume that the migrant share of the population only declined by the amount the waves 3-5 data suggests, i.e. that it was 14.3% in Q3 2019 and 13.7% in Q3 2020. It then multiplies these percentages by various different options for the total UK population size. The data suggest that even if the UK’s population had declined by 1 million, the total decline in the migrant population would be “only” around 580,000.
Table 1
Scenarios for decline in migrant population using only LFS waves 3-5
| Number of migrants | ||||
| UK population, Q3 2020 | 2019 Q3 | 2020 Q3 | Change | |
| Population grows at pre-pandemic rate (ONS assumption) | 66,441,000 | 9,474,000 | 9,081,000 | -393,000 |
| Population stays the same as in Q3 2019 | 66,068,000 | 9,474,000 | 9,030,000 | -444,000 |
| Population declines by 1m | 65,068,000 | 9,474,000 | 8,893,000 | -581,000 |
These figures are not at all conclusive, and are not intended to be a ‘better’ estimate of the decline in the migrant population. Estimates from the LFS are often volatile, and data from a single quarter often change more than one would expect as a result of sampling variation alone. It is usually therefore not a good idea to draw strong conclusions from just a couple of quarters of data. People who participate in waves 3-5 of the LFS may also be different to the ones who only participate in the first 1-2 interviews. The figures are therefore simply designed to illustrate the uncertainty we currently face when comparing pre- and post-pandemic figures over time.
However, with these caveats in mind we can reasonably draw three conclusions. First, a decline in the migrant population does appear to have taken place in 2020, at least from the data that is available to us at present. Second, migrant non-response has probably amplified the estimated decline in the migrant population, which could be considerably smaller than headline figures suggest. And third, a change in the data collection method means we should be cautious about comparing figures from before and after the change in recruitment method.
How has the profile of migrant respondents changed?
In theory, we should expect groups of migrants who are less ‘established’ in the UK to be more likely to leave – for example, people who have recently arrived and who do not have family here. However, these may be some of the same groups who could be more likely not to participate due to the new sampling method (e.g. recently arrived people with language difficulties), making it difficult to disentangle the two.
When we look in more detail at the groups that have seen the largest declines in the estimated migrant population in the all-wave data, some changes seem plausible given our theoretical expectations about what might have happened during the pandemic, while others are less so.
Decreases in the estimated migrant population are highest among those who arrived recently, as one might expect, whether the reason is emigration or non-response (Table 2). Recently arrived migrants may be more likely to leave the country, but they could also be more likely not to respond to surveys under the new recruitment method, for example if they are less confident speaking English.
Table 2
Foreign born population by year of first arrival, Q3 2019 and Q3 2020
| Q3 2019 | Q3 2020 | Change | Percent change | |
| Before 1970 | 796,000 | 739,000 | -93,000 | -11% |
| 1970-1979 | 595,000 | 519,000 | -76,000 | -13% |
| 1980-1989 | 554,000 | 528,000 | -26,000 | -5% |
| 1990-1999 | 941,000 | 927,000 | -14,000 | -2% |
| 2000-2009 | 2,889,000 | 2,479,000 | -410,000 | -14% |
| 2010-2018 | 3,190,000 | 2,698,000 | -492,000 | -15% |
Similarly, we should expect young people to be more likely to leave the UK than older people, who are more likely to be settled with multiple attachments keeping them in the country. We do indeed see the largest decline in the estimated number of migrants appears among those in their 20s (Table 3), although there are also declines in older age groups too. (Some of these are relatively small and within the bounds of normal sampling variation in the LFS.)
Table 3
Foreign born population by age, Q3 2019 and Q3 2020
| Q3 2019 | Q3 2020 | Change | Percentage change | |
| Under 10 | 374,000 | 348,000 | -26,000 | -7% |
| Age 10-19 | 680,000 | 622,000 | -58,000 | -9% |
| Age 20-29 | 1,354,000 | 1,084,000 | -269,000 | -2% |
| Age 30-39 | 2,389,000 | 2,177,000 | -211,000 | -9% |
| Age 40-49 | 1,886,000 | 1,758,000 | -128,000 | -7% |
| Age 50-59 | 1,137,000 | 1,031,000 | -106,000 | -9% |
| Age 60-69 | 719,000 | 678,000 | -41,000 | -6% |
| Age 70+ | 654,000 | 601,000 | -53,000 | -8% |
| Total | 9,193,000 | 8,299,000 | -894,000 | -1% |
Surprisingly, however, most of the decline between Q3 2019 and Q3 2020 was driven by families that included dependent children (Table 4) (note that these dependent children may themselves be either UK or foreign born). It would be surprising to see large-scale emigration in this group given that it can be difficult for people with school-age children to move. In principle, we should on the contrary expect single people with fewer attachments to be the most likely to leave the UK.
Therefore seems likely that people with dependent children have simply become less likely to respond to the survey. Indeed, among the UK-born there is also a decrease in the share of survey respondents with dependent children in the family (data not shown), suggesting higher non-response in these types of families across the board. Since people in families with dependent children make up over half of the decline in the estimated migrant population, this creates another reason to doubt the narrative that emigration alone is driving the change.
Table 4
Foreign-born population with and without dependent children, Q3 2019 and Q3 2020
| Families with… | Q3 2019 | Q3 2020 | Change | Percent change |
| …at least one dependent child age 5+ | 3,830,000 | 3,347,000 | -482,000 | -13% |
| …dependent children only under 5 | 917,000 | 770,073 | -147,000 | -16% |
| …no dependent children | 4,446,000 | 4,182,000 | -264,000 | -6% |
| Total | 9,193,000 | 8,299,000 | -894,000 | -1% |
What is happening in London?
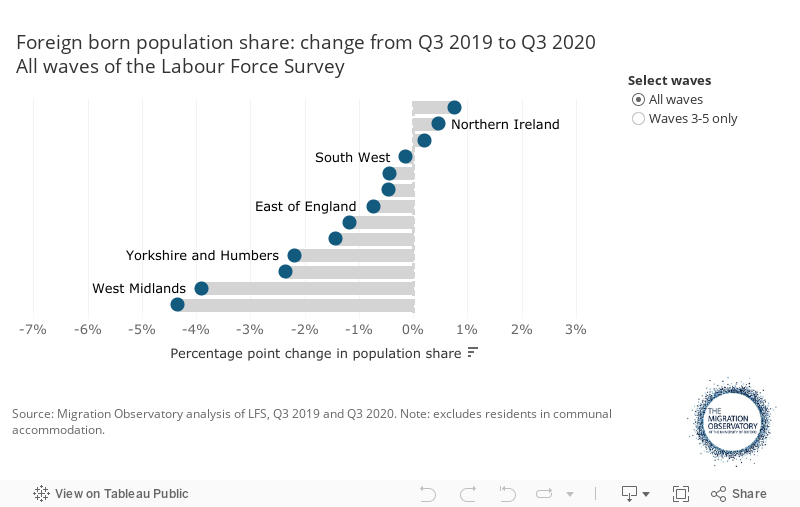
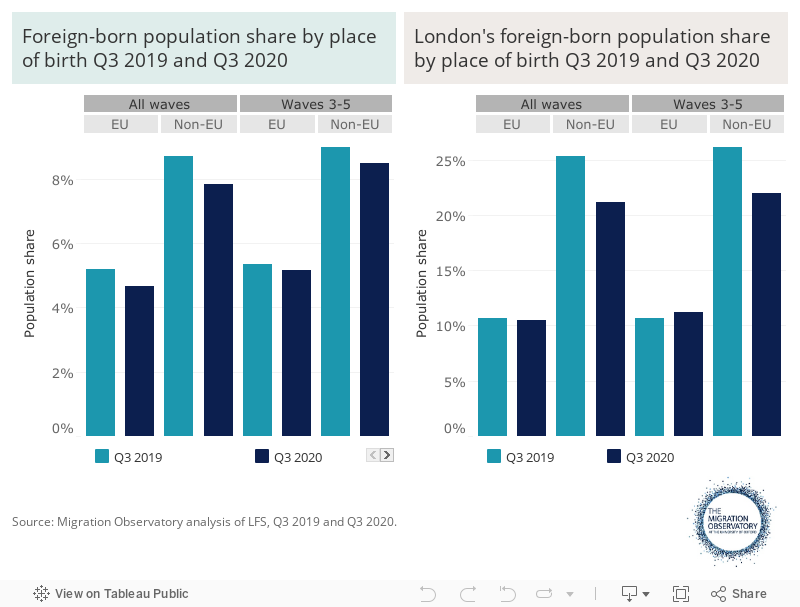
One of the most striking changes in the data is in the geographic distribution of the migrant population. Figure 4 shows the estimated change in the foreign-born share of the population from Q3 2019 to Q3 2020. The first panel uses all the LFS data, and the second panel uses only waves 3-5, i.e. those not affected by the change in data recruitment method.
The largest decline in the estimated foreign-born share of the population is seen in London (Figure 4). This appears regardless of whether we restrict the analysis to waves 3-5. The all-wave data suggest that the foreign-born share of the population fell by 4.3 percentage points, from 36.0% in Q3 2019 to 31.7% in Q3 2020. (This translates into a decline of over 360,000 people using the [problematic] assumptions about the total population discussed above.) The wave 3-5 data suggest it fell by 3.6 percentage points, from 36.8% to 33.2%. Either way, these are significant changes.
Figure 4
Which countries of origin are driving the change?
The change in the migrant share of the population for the UK as a whole appears for both EU and non-EU born groups. The full LFS data show a 0.9 percentage point decline in the non-EU born population share and a 0.5 percentage point decline for EU citizens. The wave 3-5 figures show a 0.5 percentage point decline in the population share for non-EU born and 0.2 percentage point decline for EU. In London, however, both methods suggest that the decline in the migrant share is driven primarily by the non-EU born (Figure 5).
Figure 5
How can the uncertainty be resolved?
To understand what has really happened to the UK’s migrant population, we would ideally consult a different data source not affected by the problems discussed here.
One option is the Census. This will be conducted on 21 March 2021 in most of the UK (the Scottish Census has been postponed to 2022 due to the pandemic). The data are due to become available starting from around 12 months after the Census date. This will not resolve questions about changes over the past year, since it is only conducted every 10 years, but it will at least provide a more accurate figure for most of the UK in 2021.
Another option is administrative data, such as HMRC and DWP records or visa data. Over the course of 2021 and early 2022 the Home Office will start to publish data on grants of visas under the new immigration system. This now covers both EU and non-EU citizens (unlike in 2020 when EU citizens still had free movement rights) and will give good insight into new arrivals but not the numbers of people living in the country or the numbers leaving.
The ONS is already in the process of moving towards using administrative data to produce broader migration estimates that will be more similar to previous immigration and emigration figures that were published for 2019 and previous years. However, it may be some time before new statistical publications are regularly available using the data.
Acknowledgements
Thanks to Brian Bell, Jonathan Portes, Michael O’Connor and Martina Helme for comments on an earlier draft, and to Luka Klimaviciute for research assistance. This analysis was produced with the support of Trust for London and the Joseph Rowntree Charitable Trust.
Home / publications / commentaries /
Where did all the migrants go? Migration data during the pandemic
05 Feb 2021