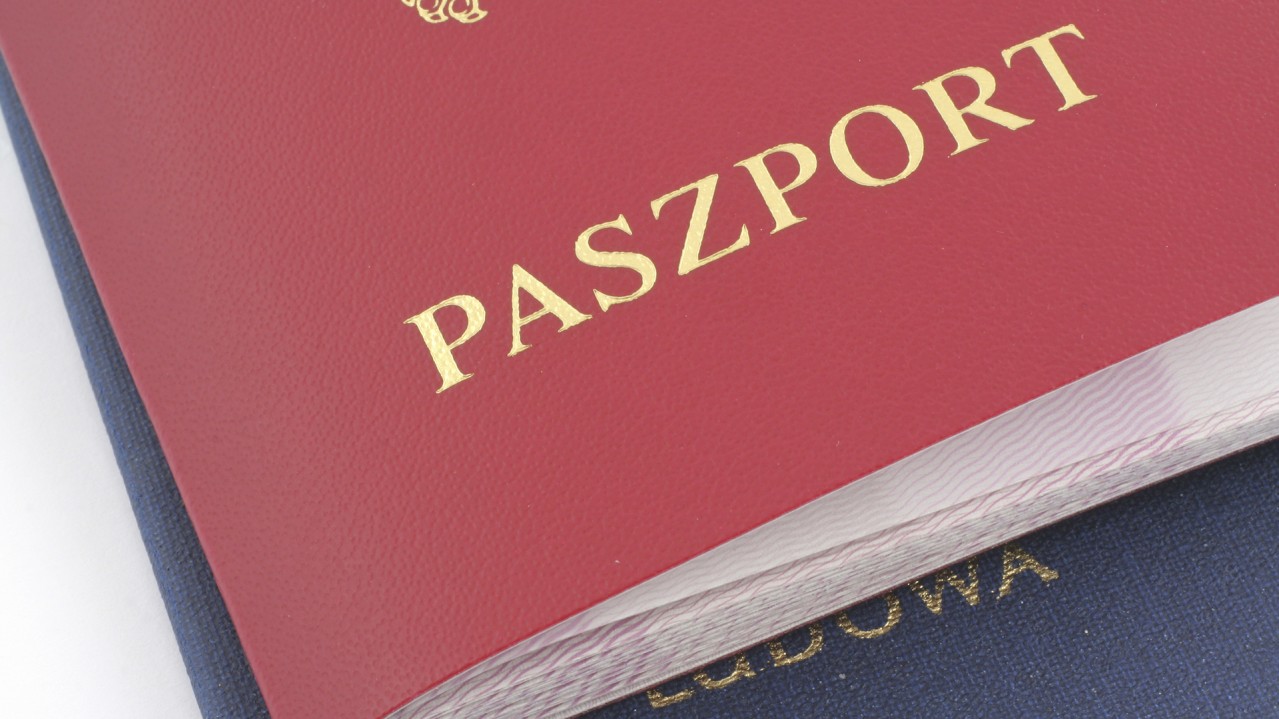
Today’s (11 December 2012) release of new data from the 2011 Census provides a wealth of information about the foreign-born populations of England and Wales. The most obvious change is the tenfold increase in the countries’ Polish-born population, which has grown from just 58,000 in 2001 to 579,000 in 2011. The data also shows a rise in the Indian-born population, which has meant that in 2011 Indian-born people have become the largest single foreign-born group, taking over from those born in Ireland, who held the position in in 2001.
Other interesting data points include evidence that half of all foreign-born people in England and Wales have lived here for 10 years or more, while one in eight arrived within two years of the 2011 Census.
Regionally, increases in the foreign-born population have followed a broadly similar pattern to the pre-existing distribution, with London hosting about 40% of foreign-born people in England and Wales (2,998,000 in 2011 compared to 1,943,000 in 2001). One key regional difference is that those born in Poland are notably less likely to live in London than the average for foreign-born people.
A changing population
Table 1 compares the ten largest groups of migrants in England and Wales – defined by country of birth – from the 2001 Census, with the ten largest groups from the 2011 Census.
Table 1
| Country of birth | 2001 Census | 2011 Census |
|---|---|---|
| India | 456000 | 694000 |
| Poland | 58000 | 579000 |
| Pakistan | 308000 | 482000 |
| Republic of Ireland | 473000 | 407000 |
| Germany | 244000 | 274000 |
| Bangladesh | 153000 | 212000 |
| Nigeria | 87000 | 191000 |
| South Africa | 132000 | 191000 |
| United States | 144000 | 177000 |
| Jamaica | 146000 | 160000 |
The table shows that in 2001 the largest single group of foreign-born people in England and Wales was those born in Ireland, followed by India and then Pakistan. In 2011, the largest single group is those born in India, followed by those born in Poland and then those born in Pakistan.
While Table 1 shows that Polish-born migrants have rapidly become the second largest single group, Figure 1 below allows us to visualise more clearly how this has happened.
Figure 1
Figure 1 shows that the population of people born in India increased in size from 456,000 in 2001 to 694,000 in 2011 while the Irish population has reduced from 472,000 to 407,000. But, Figure 1 also highlights very clearly that the biggest change is the tenfold increase in the number of Polish-born people in England and Wales.
Other notable changes that can be seen in Figure 1 are an increase in the number of people born in Nigeria, which more than doubled from 87,000 in 2001 to 191,000 in 2011 and the growth in the number of people born in Pakistan from 308,000 in 2001 to 482,000 in 2011 and a smaller increase in the number of people born in Germany from 244,000 in 2001 to 273,000 in 2011.
Regional changes
Figure 2 shows the regional distribution of foreign-born people in the UK around England and Wales in 2001 compared to 2011. The biggest growth in absolute numbers was in London – which saw its migrant population increase from 1,943,000 to 2,998,000. This means that London has continued to be home to the largest group of foreign-born people in England and Wales – about 40% of the total.
Census data shows that the Polish-born population of England and Wales is less concentrated in London (27%) than the average for foreign-born groups. The area with the smallest number of foreign-born residents in 2011 was the North East of England with 129,000 – this also had the smallest foreign-born population in 2001 (74,000).
Figure 2
Increases in England and Wales’ population of those born in EU accession countries have been a factor in the demographic changes. Figure 3 shows the make-up of residents of England and Wales born in the “A12” accession countries which joined the EU between 2001 and 2011 (the “A8” countries made up of the Czech Republic, Estonia, Hungary, Latvia, Lithuania, Poland, Slovakia and Slovenia as well as Malta, Cyprus, Romania and Bulgaria), showing that Polish-born migrants dominate this group, making up more than half of the total. The next largest group is Lithuanian-born followed by the Romanian-born.
Table 2
| EU Assession countries | Share of A12 migrant population |
|---|---|
| Poland | 51.97% |
| Lithuania | 8.71% |
| Romania | 7.15% |
| Other | 32.17% |
More detailed local level data is available through the Migration Observatory’s Create Your Own Chart feature.
Length of stay
Figures 4 and 5 provide an outline of the length of stay of migrants, showing that by a substantial margin, the largest number of migrants currently resident in the UK arrived in the last 10 years (Figure 4) and that in 2011 about half of all foreign-born people in the UK had been resident in England and Wales for more than 10 years, while around one in eight had arrived in the last two years (Figure 5).


Home / publications / commentaries /
Pole position – New Census data shows ten-fold growth of England and Wales’ Polish population
12 Dec 2012