
By Ben Brindle and Madeleine Sumption
Criminal convictions and the non-citizen prison population have generated substantial debate. One of the key questions in this debate has been whether migrants are more or less likely to be convicted of—or imprisoned for—criminal offences. This commentary lays out what available data can tell us on this question.
Key points
- We cannot precisely compare conviction and incarceration rates among British and non-UK citizens because there are no reliable statistics on the current size of the population, but available statistics can give a rough indication of the trends.
- Young adults are more likely to commit crimes regardless of nationality, and non-citizens in the UK are more likely to be young adults. If we do not control for age, the share of non-citizens receiving convictions (13%) or in prison (12.4%) in 2024 in England and Wales appears to be roughly similar to the share of non-citizens in the age 16+ population. That share was estimated at around 12% in 2024, in a survey that tends to undercount recent migrants and has not fully captured the unusually high levels of migration seen between 2021 and 2024. If we control for age and sex, non-citizens are underrepresented in the prison population (comparable figures for convictions by age are not available).
- Convictions and incarceration rates vary by offence type, however. Non-citizens are overrepresented among convicted or incarcerated offenders for drug offences, for example, while underrepresented among those convicted or incarcerated for robbery or violence against the person.
- Rates of conviction and imprisonment in England and Wales differ by nationality. Citizens of some countries have been more likely than British citizens to be convicted (e.g. Lithuanians) and some less likely (e.g. Indians and Chinese). Reliable comparisons are difficult for migrant groups with small populations living in the UK, such as Afghans or Eritreans, because there is more uncertainty about how many are living in the UK.
What data are available on criminal offences and citizenship?
The highest quality data we currently have on non-citizens in the criminal justice system is on the prison population. These are official statistics that have been through quality assurance before publication. They provide data on UK and non-UK nationals held in prison for criminal offences, with a small share of people (around 0.4% in June 2025) whose nationality is not recorded. (Immigration detention is not included in the statistics.) They also provide breakdowns by age, sex, sentence length, and offence type. Prison data only cover a small portion of offenders—namely, those who are awaiting trial or have been sentenced for more serious crimes that attract prison sentences. The number of foreign nationals in prison is also shaped by sentence lengths and policies that allow prisoners to be returned from the UK before the end of their sentence, such as the Early Removal Scheme.
Convictions data also exist and can be obtained by FOI, but are not published official statistics. They come with lower quality assurance and limited explanation of how the data are produced. Convictions data cover a wider range of offences than prison statistics and are not influenced by sentence lengths or early release policies.
The foreign national share of the prison population will not exactly match their share of cautions and convictions, particularly since the pandemic, as court backlogs have grown, delaying sentencing decisions.
How do rates of criminal convictions and incarceration compare for UK and non-UK citizens?
In June 2025, 12.4% of the prison population were non-UK nationals, excluding people with no recorded nationality. Around 13% of cautions and convictions in 2024 were given to non-citizens (excluding 5%, where no nationality was recorded). These shares have been broadly flat over the past decade, despite the non-citizen share of the population increasing over this period.
How do these shares compare to non-citizens’ representation in the population of England and Wales more broadly? Perhaps surprisingly, we do not currently have especially reliable figures on the share of non-citizens in the population, due to various problems in official data sources. Estimates from the 2024 Annual Population Survey—the most recent available—suggest that roughly 12% of people aged 16 or over were non-citizens that year, but this may be an underestimate: response rates are lower among recent arrivals, and the UK experienced unusually high migration from 2021 to 2024. In addition, the ONS does not interview people living in communal establishments, such as asylum hotels, student halls, and prisons.
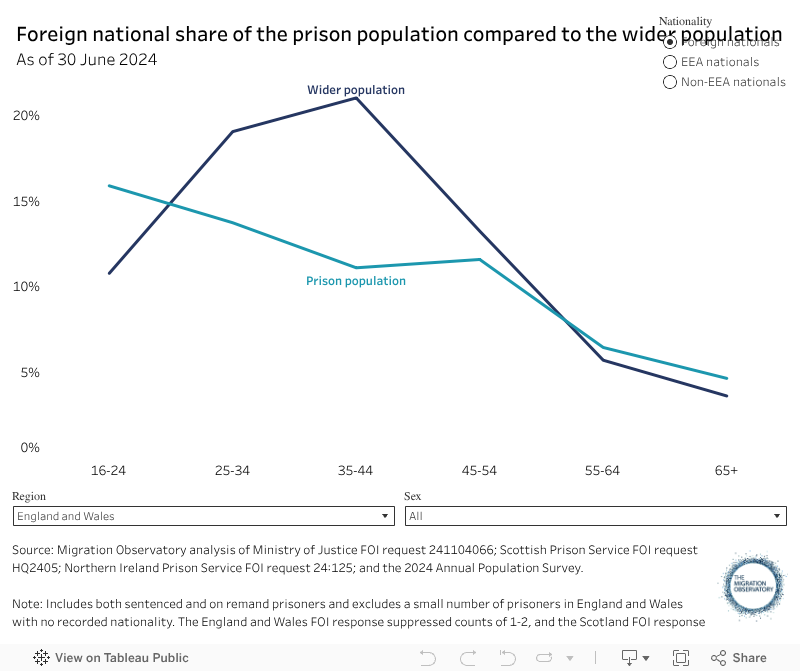
The share of prisoners who are foreign nationals varies by age and sex, however. Age is extremely important when examining crime statistics, because young adults are much more likely to commit offences. Migrants in the UK (as in other high-income countries) are also more likely to be young adults. This means that if non-citizens and citizens of the same age were equally likely to be convicted or incarcerated, we should expect a higher share of non-citizens to be in prison overall.
The prison statistics provide an age breakdown that allow us to examine this question (the conviction statistics currently available do not). In practice, the share of people in prison who are non-citizens falls with age: from 16% in the 16-24 category, to 5% among those age 65+. Compared with the wider population of the same age, non-citizens are overrepresented in the youngest age group (16-24). They are underrepresented among 25 to 54-year-olds, who together comprise three-quarters of the prison population (Figure 1). Overall, if we control for age and sex, non-citizens were slightly less likely to be in prison than UK citizens (see Appendix A).
Note that men comprise around 95% of the prison population, so migrant groups that had a higher share of men would also be expected to have higher rates of criminal convictions and incarceration. Overall, however, the migrant population is roughly evenly divided between men and women.
Figure 1
How do convictions and incarceration vary by offence type?
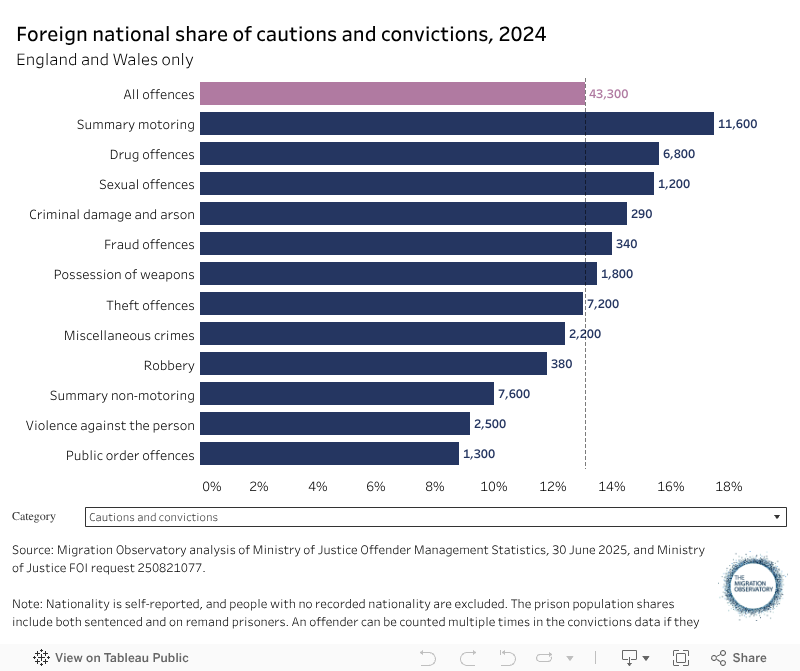
Compared to British citizens, non-citizens have been overrepresented among those cautioned/convicted and incarcerated for drug and fraud offences but underrepresented for violent offences and robbery (Figure 2). Some, but not all, of these differences may reflect the different age profiles of people who commit different types of offences (see Soothill et al. and Hughes and Hartman for an in-depth discussion). In the case of drug offences, the National Crime Agency suggest that some of those imprisoned for drug offences are victims of trafficking or modern slavery who have been coerced to commit offences. However, there are no data on the proportion of the prison population that this may involve.
The picture is more complicated for certain types of crime, such as sexual offences, where foreign nationals are overrepresented among those cautioned/convicted but underrepresented in the prison population. See Appendix B for a discussion of possible explanations.
Figure 2
How do convictions and incarceration vary by nationality?
It is likely that rates of criminal convictions and incarceration vary substantially by nationality, due to differences in people’s age, reasons for migration, socio-economic status and previous life experiences. However, understanding how much incarceration varies by nationality is difficult because there are currently no reliable estimates of the number of people from each nationality living in the UK.
The Census provides reasonably good estimates of the population by individual nationality based on the passport they hold. But it is now four years old, and during that period, net migration was unusually high. If we want to look at rates of incarceration by nationality, it is more reliable to go back to the criminal justice statistics for 2021, at the time the Census was conducted. Yet some problems comparing small groups remain even when using this data. The Census is likely to have undercounted certain people, such as unauthorised migrants who want to avoid contact with the state, people who have been trafficked, and people without stable addresses. Some people have no passport, so their nationality is not known. The Census estimates also do not include visitors. If people are convicted and imprisoned while visiting the UK (either as tourists or even having visited for the purpose of organised crime), they would be counted in the prison statistics but not the population data.
One example is Somalia. The Census counted only 2,130 non-naturalised Somali passport holders in England and Wales. However, Somali-born migrants were more likely than average to hold no passport: a further 6,200 people, many of whom will be Somali citizens but whose nationality is not known. With such small migrant populations of each nationality, an inaccuracy of just a few thousand people can have a very large impact on the estimated rates at which people are convicted or incarcerated.
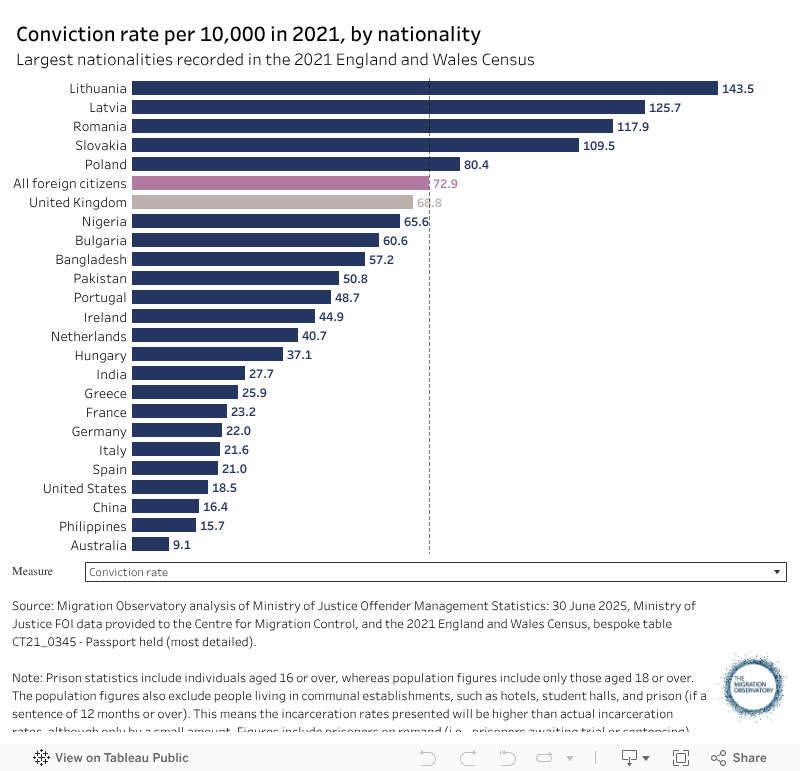
Nonetheless, it is clear that rates of convictions or incarceration do vary substantially by nationality. Certain nationalities – including Albanians, Iranians, and Afghans – are among the most common non-UK nationalities in the prison population but have relatively small populations living in the UK. They are therefore clearly overrepresented in prisons, even if it is difficult to calculate precisely how much.
Comparisons for larger migrant groups are likely to be more reliable because they are less sensitive to variations caused by relatively small numbers of additional unmeasured people. Figure 3 shows the incarceration rate per 10,000 people for the top nationalities by passport held at the time of the 2021 Census. Note that the prison population includes individuals aged 16 or over, whereas the Census data used here only includes individuals aged 18 or over. This will slightly overstate incarceration rates for both Brits and non-citizens.
Figure 3
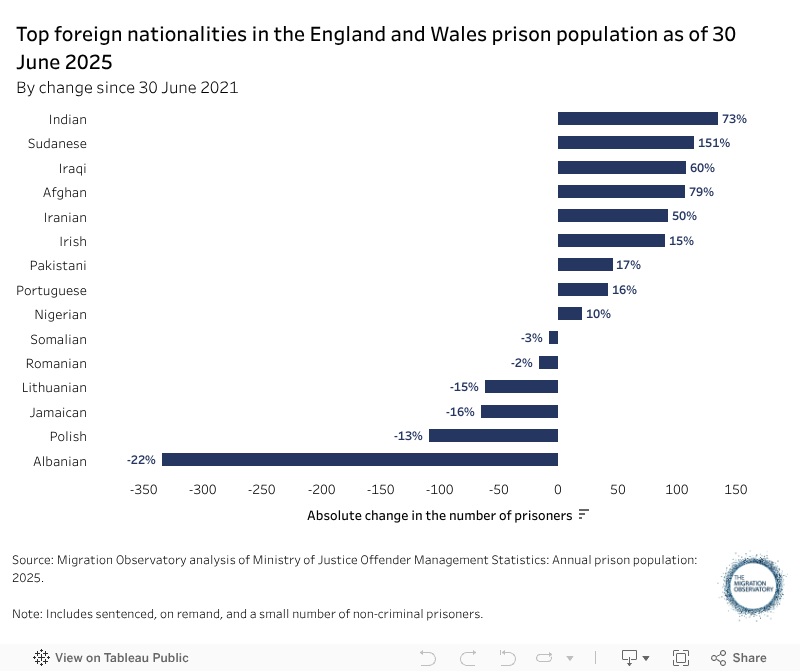
Although the number of non-citizens in the prison population has risen by around 950 since then, their share has not, because the number of Brits in prison increased at a similar rate. There have been changes in the composition, however (Figure 4). The number of Albanians in prison fell significantly between June 2021 and 2025, coinciding with a period of greater cooperation between the UK and Albanian governments and a UK strategy of prioritising Albanians for removal. There were fewer Polish and Vietnamese nationals in prison, too. By contrast, prisoner numbers from India, Sudan, Iraq, and Afghanistan increased over the four years. All are nationalities that will have seen substantial increases in the overall population—India as a result of record high net migration, and Sudan, Iraq and Afghanistan as a result of higher asylum migration. It is not possible to examine the role of immigration status directly because the Ministry of Justice does not collect this information.
Figure 4
Conclusion
Overall, rates of incarceration and criminal convictions are broadly similar for foreign and British nationals. When controlling for age and sex, the share of non-citizens who are incarcerated is lower than among Brits. The available data is not yet sufficient to conduct the same analysis for convictions, although the Migration Observatory has requested the relevant data from MoJ.
Estimating variation in rates of convictions or incarceration by nationality is particularly challenging because of the lack of reliable data on the size of different migrant groups, particularly for smaller nationalities. Nonetheless, we can still see substantial variation in incarceration by nationality. This may reflect differences in the characteristics of people who come to the UK from different countries, such as their age, sex, socio-economic background, and previous life experiences.
While these snapshots can give us a better understanding of the relationship between migration and crime, there is still much we do not know. For instance, there are no reliable data on convictions or the prison population by immigration status, or duration of residence in the UK—as a result, we do not know whether foreign nationals in the criminal justice system have lived in the UK for months, years, or decades, or if they even live in the UK at all.
NOTE: this analysis was edited on 2 October 2025 to amend the interpretation of Somali passport holder numbers in the Census.
Acknowledgements
With thanks to Michael Shiner, Ian Brunton-Smith and Paula Harriott for comments on an earlier draft.
Appendix A
Table 1 shows the projected non-citizen prison population if foreign nationals within different age and sex groups were incarcerated at the same rate as British citizens in the same age and sex bracket.
Table 1
| British nationals | Foreign nationals | |||||
|---|---|---|---|---|---|---|
| Incarceration rate per 10,000 | Wider population (likely an underestimate) | Projected share of prison pop. if incarceration rate same as British | Actual foerign share of the prison pop. | Difference | ||
| Male | 16-24 | 32.8 | 319,000 | 10% | 16% | 6% |
| 25-34 | 69.0 | 682,000 | 17% | 14% | -3% | |
| 35-44 | 68.6 | 748,000 | 20% | 11% | -9% | |
| 45-54 | 31.6 | 481,000 | 12% | 11% | -1% | |
| 55-64 | 17.3 | 211,000 | 6% | 7% | 1% | |
| 65+ | 6.8 | 157,000 | 3% | 5% | 1% | |
| Female | 16-24 | 0.9 | 337,000 | 11% | 15% | 4% |
| 25-34 | 3.1 | 839,000 | 21% | 13% | -8% | |
| 35-44 | 3.9 | 865,000 | 22% | 9% | -13% | |
| 45-54 | 1.6 | 547,000 | 14% | 13% | -1% | |
| 55-64 | 0.7 | 215,000 | 6% | 2% | -4% | |
| 65+ | 0.1 | 234,000 | 4% | 5% | 1% | |
Source: Prison population: Ministry of Justice FOI request 241104066; and wider population: 2024 Annual Population Survey.
Note: All figures for 2024. Foreign national population figures are rounded to the nearest thousand.
Overall, we would have expected there to have been 13,615 non-citizen prisoners in England and Wales on 30 June 2024 – or 15% of the prison population – after controlling for age and sex. This is 3,193 more than were actually in prison (10,422, or 12%).
Appendix B
Figure A1 compares the foreign national share of cautions/convictions and the prison population in 2024, by offence type. These proportions are not expected to match exactly—cautions and convictions primarily relate to current criminal activity, whereas prison population figures also reflect past criminal activity. However, over the past decade, non-citizens have consistently accounted for a higher proportion of people convicted for sexual and theft offences than their respective shares in prison. One reason may be that, on average, non-citizens commit less serious sexual and theft offences that do not attract a prison sentence. This pattern could also reflect courts’ assessments of reoffending risk in light of defendants’ individual circumstances.
Figure A1
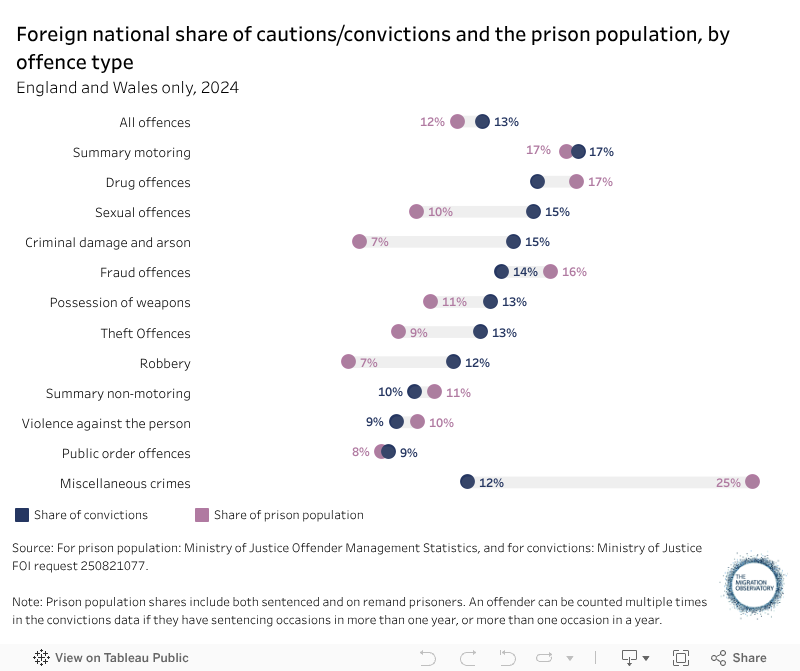
At the same time, the share of foreign nationals among those in prison for committing certain miscellaneous crimes – ranging from possession of indecent images to handling stolen goods – is significantly higher than their share of convictions. The reason is unclear, as no detailed breakdowns of this offence category by nationality are published.
Home / publications / commentaries /
How do conviction rates and prison populations differ between British and foreign nationals?
30 Sep 2025