This briefing note examines the number of EU migrants registered to vote in Britain and how this has changed in recent years.
-
Key Points
- Since May 2024, EU citizens have faced more limited voting and candidacy rights in local elections in England and Northern Ireland
More… - In 2022, over 2.3 million EU citizens were registered to vote in local elections in England, Wales, and Scotland.
More… - In 2022, an estimated 68% of eligible EU nationals were registered to vote in British local elections
More… - At the time of the 2021/22 Censuses, around 936,000 EU-born residents had the right to vote in the UK’s national elections
More…
- Since May 2024, EU citizens have faced more limited voting and candidacy rights in local elections in England and Northern Ireland
Since May 2024, EU citizens have faced more limited voting and candidacy rights in local elections in England and Northern Ireland
Under free movement, EU citizens living in the UK had full rights to vote and stand as candidates in local elections. Since these rights were enshrined in British legislation, they did not lapse at the time of Britain’s official withdrawal from the EU on 31 December 2020. All EU citizens living in the UK continued to be able to vote and run as candidates in local elections across Britain until 2023.
This changed starting with the last round of local elections in May 2024. The Elections Act 2022 restricted EU citizens’ voting rights in England and Northern Ireland to reflect the fact that the UK is no longer required to give voting rights to all EU citizens automatically. The voting and candidacy rights of EU citizens now depend on when they moved to the UK and which member states they come from. EU citizens who were living in the UK by 31 December 2020 maintain the same rights as before.
Table 1
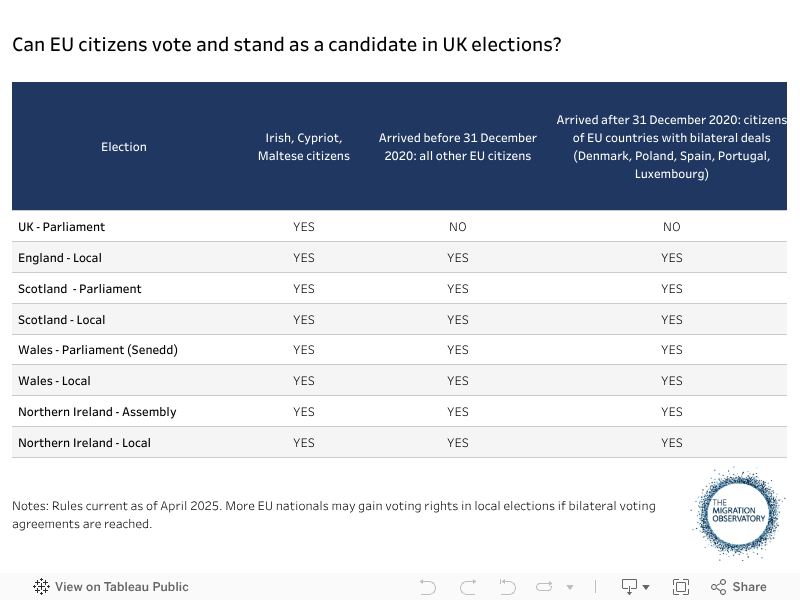
However, EU citizens who arrived in the UK after 31 December 2020 no longer have an automatic right to vote and stand in local elections. Such rights will be restricted to citizens of Member States with which the UK has signed bilateral voting agreements. As of April 2025, agreements had been reached with five Member States – Denmark, Poland, Spain, Portugal, and Luxembourg.
Note that none of these changes apply to citizens of Malta, Cyprus, and the Republic of Ireland. Nationals of these countries will retain full voting rights across the UK in both local and national elections, because of their states’ historical links to the UK and the Commonwealth. The new legislation only covers nationals of the other 20 Member States who moved to the UK from 1 January 2021. Before implementation, the British Government said it expected that around 160,000 EU nationals would be removed from the voter register in England due to its policy change. However, no data have been published on these changes.
The Welsh and Scottish governments independently administer their local elections under devolution agreements with London. EU citizens will maintain their full voting and candidacy rights in both nations, irrespective of their origin or when they moved to the UK. The two devolved administrations changed their rules in recent years and now allow all foreign nationals who are legally resident to vote or stand in local elections, as well as regional ones.
Figure 1
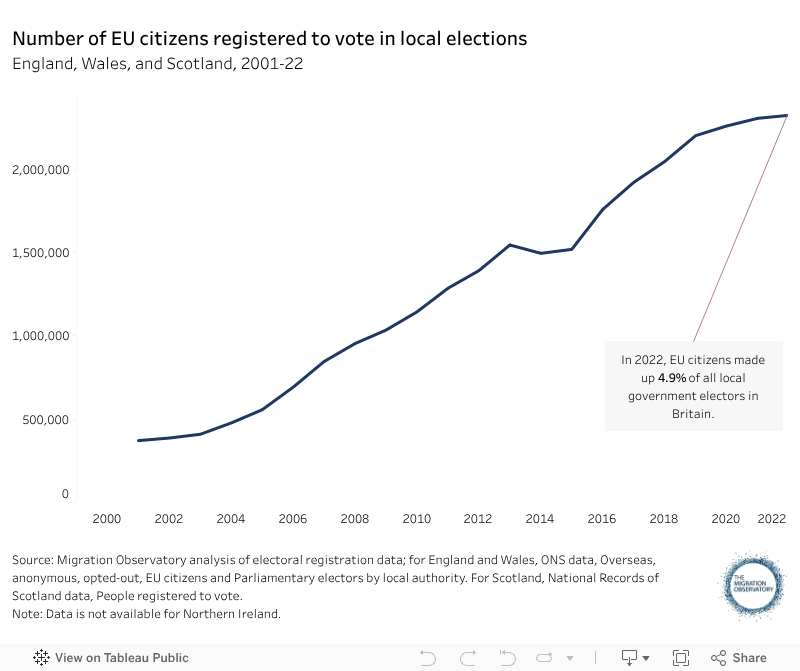
In 2022, over 2.3 million EU citizens were registered to vote in local elections in England, Wales, and Scotland
Over 2.3 million EU citizens were registered to vote in local elections across England, Wales, and Scotland at the end of 2022, making up around 5% of all 47 million local government electors. More recent data were not available. The number has increased steadily over time as migration from the EU increased in the 2000s and 2010s. (Figure 1). Since 2010, the number of EU nationals on the electoral register has more than doubled.
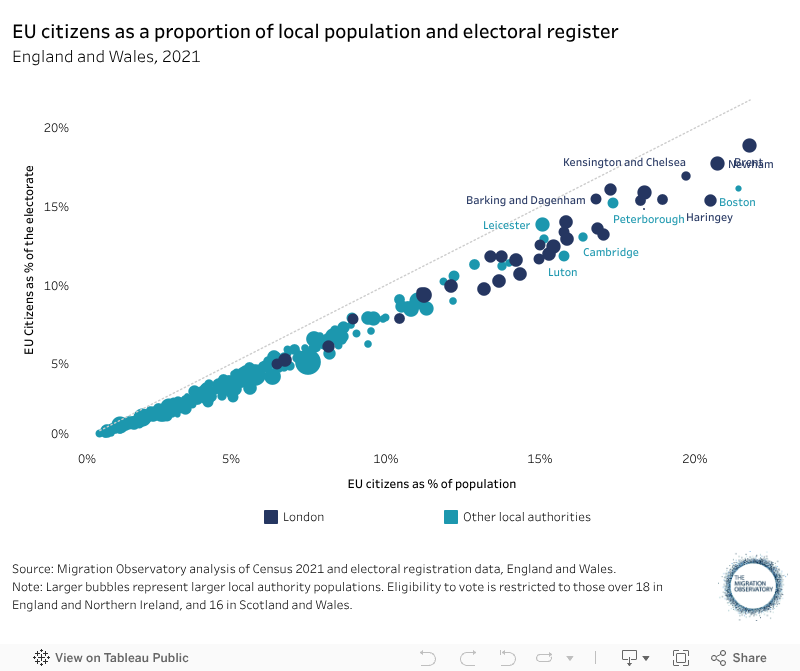
In general, local authorities with a higher share of EU passport holders are also those with a higher share of EU citizens on the electoral register (Figure 2). Local electors from the EU are particularly concentrated in areas of Greater London – Brent is the local authority with the highest share of EU electors, at 19%, and also the highest share of EU passport holders (22%). This is followed closely by a number of other London boroughs with high shares of EU electors, including Newham (18%), Kensington and Chelsea (17%), and Hounslow (16%). Some other local authorities in England also have very high shares of electors from the EU. This includes Boston in Lincolnshire (16%), Peterborough (15%), Cambridge (13%), Leicester (14%), and Luton (12%).
Figure 2
In 2022, an estimated 68% of eligible EU nationals were registered to vote in British local elections
Not everyone who is eligible to vote registers to do so. Individuals are required to register with their local authority once they become eligible to vote or after changing their address. A significant minority of people do not, particularly the young and those who have recently moved. According to 2022 data from the Electoral Commission – the most recent available – about 87% of eligible UK or Irish nationals were on the electoral register. The figure was 68% for EU citizens. There were over 3.2 million EU passport holders over the age of 16 in England and Wales in 2021, compared to a little over 2.1 million local government electors. This implies that approximately 1 million EU nationals had not registered to vote in local elections despite being eligible to do so.
Some non-citizens may have limited information about the electoral process or struggle with some of the linguistic and bureaucratic barriers to registration. EU nationals also tend to come from countries with automatic voter registration, which further compounds information asymmetries. Recently arrived non-citizens may see less benefit to their electoral participation, especially if they still plan to return to their origin countries in the future.
Voter turnout among EU citizens is not known. Many migrants remain vulnerable to socio-economic marginality, which is known to depress political participation. In addition, they are less likely to be embedded in tight social networks and be mobilised by political parties, factors shown to encourage participation.
Although data remain limited, research suggests that lower electoral participation among migrants and ethnic minorities is largely explained by lower rates of voter registration. Once registration rates are accounted for, their turnout is broadly comparable to that of other groups.
In 2021/22, around 936,000 EU-born residents had the right to vote in the UK’s national elections
EU citizens’ rights to vote and stand as candidates in the UK were always limited to local elections. EU citizens were normally not permitted to participate in national British elections, which remained the case after Brexit. To be allowed to vote in parliamentary elections, individuals must be British citizens, a national of the Republic of Ireland, or of one of the Commonwealth countries (including Malta and Cyprus).
According to the 2021/22 Censuses[1] – the most recent data available – there were around 936,000 EU-born residents with the right to vote in UK parliamentary elections. The largest group were EU-born EU citizens who hold a British passport. Though naturalisation rates remain much lower than for other migrant groups, around 636,000 (16%) EU-born residents of the UK held a British passport in 2021/22. Another approximately 300,000 were those born in Ireland, Cyprus, and Malta and without a UK passport (this excludes Scotland, where detailed data were not available). As long as they are nationals of their country of origin, these individuals have a right to vote due to their countries’ historical links to the UK.
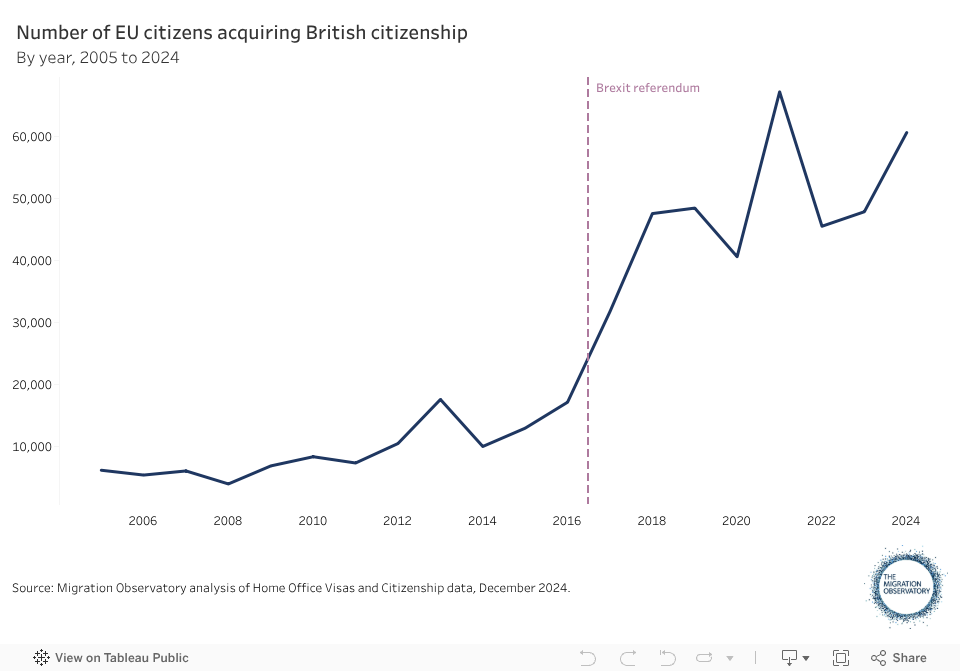
The number of EU-born residents with the right to vote in UK national elections will likely increase in the coming years as more of them acquire British citizenship. The number of EU citizens acquiring British citizenship increased sharply after the Brexit referendum in 2016, from an average of under 10,000 a year in 2005-15 to more than 45,000 a year in 2016-24 (Figure 3).
Figure 3
It remains unclear how much naturalisations will increase in the future and the extent to which rates will converge to the much higher ones seen for non-EU migrants. However, there is a large pool of EU migrants who are either eligible for British citizenship or will become eligible in the near future. For example, around 3.8 million EU citizens had been granted settled status by the end of 2024 (for more detail on the naturalisation of EU migrants, see our briefing note on Characteristics of EU migrants in the UK).
Besides their right to vote, EU nationals in the UK have long been eligible to stand as candidates in local elections, and those who arrived before 31 December 2020 will retain this right into the future. The media has reported multiple instances of EU nationals, including Romanian and Polish ones, being elected as councillors in 2021 and before. However, no data exist on the nationality background of elected officials, and it remains unclear how many EU nationals have been elected or whether they also held British citizenship.
Footnotes
[1] There were three separate Censuses conducted separately by UK devolved authorities – England & Wales, Northern Ireland, and Scotland. Scotland conducted its Census a year later than the rest of the UK, in 2022. Our estimates combine 2021 data for the rest of the UK with Scottish data for 2022.