
This briefing provides an overview of attitudes toward immigration in Britain. The discussion focuses on five questions. First, do people favour or oppose immigration to the UK, and is it seen as one of the most important issues facing the country? Secondly, are attitudes changing over time? Third, how does the UK compare to its European neighbours in its views? Fourth, how do preferences differ by immigrant type? And fifth, how do attitudes differ among people of different ages, different levels of education, and differing political preferences?
-
Key Points
- Overall views are divided in Britain. In April 2023, 52% thought that immigration numbers should be reduced. The level of opposition varies by the type of question, and fewer people (32%) said that immigration was a bad or very bad thing.
More… - Evidence from multiple sources showed that attitudes had been softening, but the latest data from 2023 show an ‘uptick’ in concern for the first time since before the Brexit Referendum.
More… - Concern about immigration declined after the 2016 Brexit Referendum, but salience rose from late 2022 to late 2024 and was the top ‘most important issue’ (at 38%) in October 2024 for the first time since 2016.
More… - Attitudes in the UK are among the more positive compared to our European neighbours.
More… - British people make clear distinctions between types of migrant, with the highly skilled preferred to unskilled overall, and the majority in favour of making immigration easier for health care workers.
More… - Younger people and people with university degrees tend to express more positive attitudes to immigration, and Labour voters tend to express more positive attitudes than Conservative voters.
More…
- Overall views are divided in Britain. In April 2023, 52% thought that immigration numbers should be reduced. The level of opposition varies by the type of question, and fewer people (32%) said that immigration was a bad or very bad thing.
-
Understanding the Evidence
The data for this briefing come from polls and surveys of representative samples of the adults in Great Britain or the UK conducted by professional polling firms and academic survey organisations. This briefing relies on data from the British Election Studies and the European Social Survey, which both have a reputation for high quality based on their sampling and interview procedures. We also draw on data from the 2017-19 CSI Brexit Panel. In addition, we use polling data from Ipsos, using their publicly available reports and data, which has some of the best available time-series data available on the ‘most important issue’ and on ‘too many immigrants’. We also use new data from an online survey collected jointly by Kantar and the Migration Observatory in April 2023.
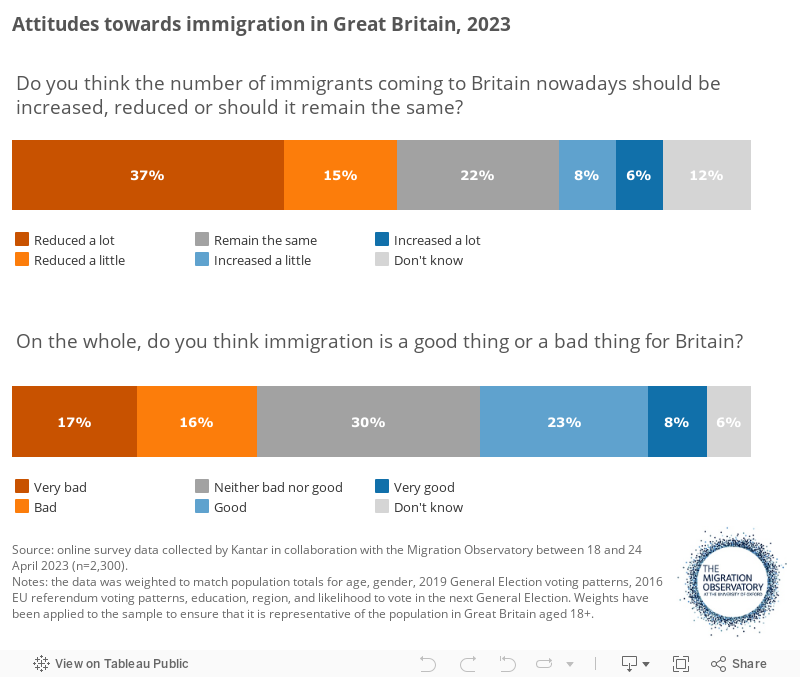
Asking people about their views on immigration is not always straightforward. Definitions and categories are a particular problem: individual respondents and survey organisations may have different ideas of who ‘immigrants’ are [1]. Question-wording matters: when people are asked, for example, if they think that immigration is a good or a bad thing for Britain, we see quite different levels of opposition compared to when they are asked whether the migration inflows to the UK should be increased, reduced or remain the same (See, for example, Figure 1). We also show that there are large differences when asking people about different types of migrants. Taking a holistic approach is always a good idea, rather than relying on just one or two survey questions.
Interpreting social survey data always requires care and caution, for they have important limitations and flaws. In order to address limitations, we attempt to corroborate findings where possible with multiple indicators and multiple data sources.
Public opinion on migration in the United Kingdom is divided
Existing evidence shows that public opinion is divided when it comes to migration. However, the level of opposition is remarkably different depending on whether we ask respondents if they think that immigration is a good or a bad thing for Britain compared to when they are asked whether the migration inflows to the UK should be increased, reduced or remain the same. In April 2023, 32% thought immigration was a very bad or a bad thing, while 52% thought their numbers should be reduced (a little or a lot) (Figure 1). These differences likely reflect the fact that people are thinking about different phenomena (current immigration inflows vs. overall impact of immigration) for each of the two questions.
Figure 1
After a decade of softening attitudes, opposition to immigration showed an uptick in 2023
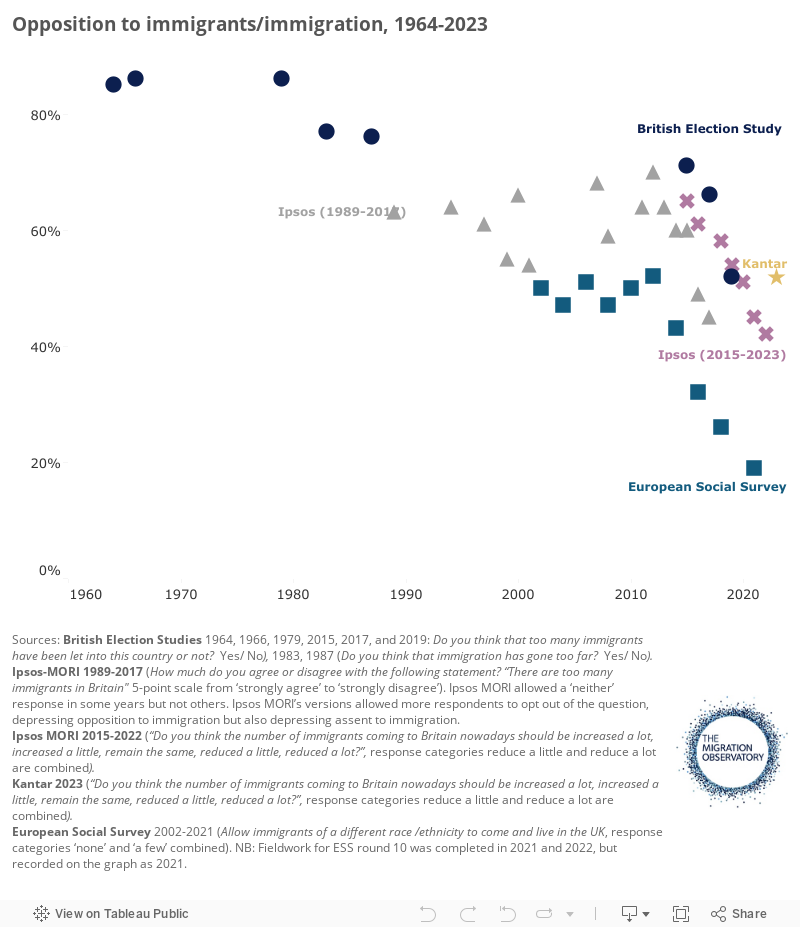
Opposition to the arrival of immigrants in the UK is not new. Rising concern about ‘New Commonwealth’ immigration prompted the British Election Study (BES) to begin asking the public about immigration as far back as 1964, although in those early years, it did not ask the question to ethnic minority respondents. Throughout this period, the majority of people in Britain agreed that there were too many immigrants in the UK.
Figure 2 looks at trends in opposition to immigrants/immigration; however, the variety of available data sources and the changes to question-wording over the years mean this cannot be seen as one coherent continuum. The data points derived from BES show that opposition to immigration was high in 1964, 1966 and 1979, with 85-86% of people at each of those times reporting that there were too many immigrants in Britain. The data points from 1983 and 1987 were based on slightly different question wording to the rest (‘Do you think that immigration has gone too far?’), so we need to consider these with caution. However, the earlier question (‘Do you think that too many immigrants have been let into this country or not?’) was brought back in 2015 when the percentage agreeing that there are too many immigrants had dropped to 71%, then to 66% in 2017, and by the general election in 2019, it had dropped further to 52%.
The series from Ipsos data goes back to 1989. Here too, we have reason to be cautious in interpreting some of the results as the response options in most years included a ‘neither agree nor disagree’ answer category, but for some years, it did not. Answers tend to be less favourable where there is no neutral answer option, and this may explain the spike in 2012, for example. Nonetheless, consistent question wording from 2013 to 2017 suggests that there was a change of attitudes over this period, with just 45% agreeing that there were too many immigrants in 2017 compared to 64% just four years earlier. We include a second series using Ipsos data, which runs from 2015 to 2023, and Kantar data for 2023. Both Ipsos and Kantar asked the public whether they thought that the number of immigrants coming to Britain should be increased or reduced. Data shows that there was a softening of attitudes from 2015 to 2022, with the percentage saying that immigration should be reduced dropping from 65% to 42% over these seven years. However, there has been a recent increase in the share of people saying that immigration should be reduced from 42% in 2022 to 48% in 2023 (and up to 52% with the Kantar data from the same year), which may be the result of the increase in political salience of immigration-related issues, as discussed further below.
Finally, Figure 2 also shows the trend from the European Social Survey, which asked a rather different question about whether people of a different race or ethnicity should be allowed to come and live in Britain. This series provides corroborating evidence for the softening of attitudes we observed in the other data series up to 2022. While the level allowing only ‘a few’ or ‘none’ was consistently hovering at around 50% between 2002 and 2012, it had dropped to 43% in 2014, 32% in 2016, 26% in 2018, and 19% by 2021. However, the most recent estimate shows the level of opposition has risen to 25% in 2023. Thus, two of our time series agree on a recent uptick.
Figure 2
Concern about immigration declined after the 2016 Brexit Referendum, but salience rose from late 2022 to 2024
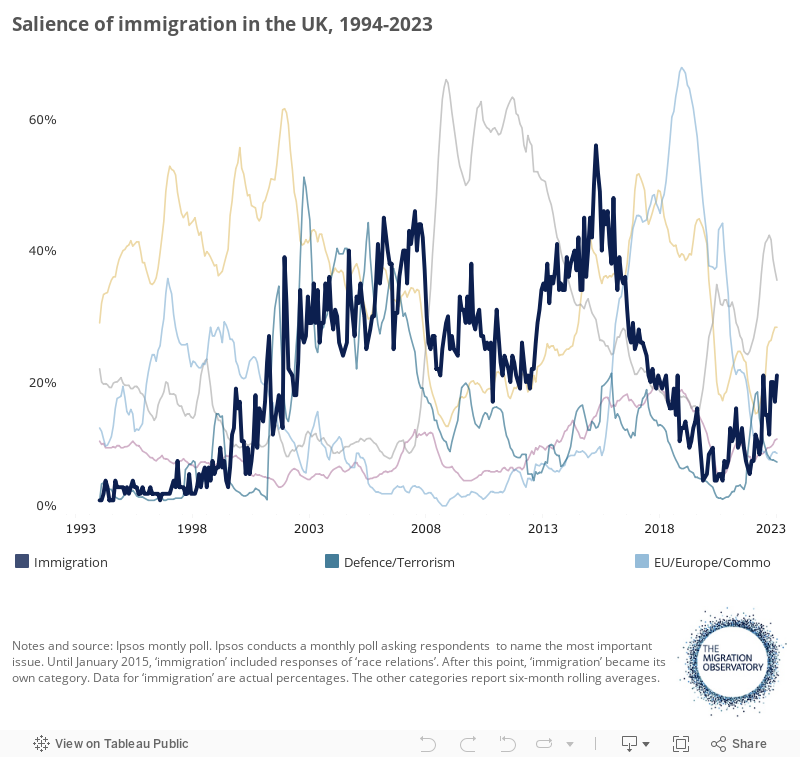
Another way to monitor public views on immigration is by asking people to name the ‘most important issue’ or ‘issues’ facing the nation. This approach assesses the salience of immigration as an issue rather than directly measuring people’s attitudes toward immigration. Ipsos conducts a monthly poll asking respondents first to name the most important issue, and after they reply, they are asked to name any ‘other important issues’. Unlike the other survey questions reported here, respondents are not prompted with particular topics they simply reply with whatever comes to mind. After assigning each response to one of 47 categories, Ipsos reports how many respondents chose each of these categories for each monthly sample.
Figure 3 tracks the percentage of respondents naming ‘race relations’ or immigration as one of the most important issues facing Britain relative to five other frequently named (and long-running) issues. These other issues are presented as six-month moving averages to make the chart easier to visually interpret.
In the year before the EU referendum, between June 2015 and June 2016, immigration was consistently named as the most salient issue facing the country, peaking at 56% in September 2015. In 1994, which was the starting point of this data series, less than 5% of respondents thought of immigration as a concern, and it remained rarely mentioned prior to 2000. The increasing rate of immigration from the EU since the accession of the “A8 countries” to the EU was accompanied by a clear change in public mood between 2001 and 2016.
During the month of the EU Referendum in June 2016, 48% of people mentioned immigration as an important issue; however, immigration steadily declined in salience and was mentioned by increasingly fewer people in the years that followed. There was a corresponding spike of concern about Europe, but this also declined steeply after the transition period came to an end. By mid-2018 and for all of 2019, immigration was mentioned by fewer than 20% of respondents. It is perhaps not surprising that by April 2020, people were mainly concerned about the coronavirus pandemic and immigration was mentioned by just 5% of participants. Concern about the pandemic (which we do not show in the graph due to its relatively short-lived salience) displaced other concerns throughout 2020 and 2021.
From the second half of 2022, however, immigration has been gaining salience once more; from a low of 6% in April 2022, salience rose and stayed consistently above 20% from March 2023 to May 2024, before rising further above 30% after June 2024. In October 2024, the figure reached 38%, showing immigration to be a top issue of concern for the first time since 2016. During this period, immigration has been prominent in the news, with record net migration figures hitting the headlines as well as irregular immigration and the issue of housing asylum seekers featuring large in the political agenda.
Other recent trends include rising concern for the NHS, which elicited a similar level of concern to immigration at 36% in October 2024. Note that respondents can name more than one issue if they want to, and the totals come to more than 100%.
Figure 3
How do British attitudes towards immigration compare to elsewhere?
Figure 4 shows two different measures from the European Social Survey for 13 countries: the first shows the percentage of people saying that a few or no immigrants of a different race/ethnicity should be allowed. At 25%, the UK was among the least anti-immigration of these countries in 2023, and only the public opinion from Norway was more favourable. The least favourable views towards immigrants of a different race/ethnicity are seen in Hungary and the Slovakia. Note, however, that this question combines attitudes to immigration and ‘race relations’.
Figure 4
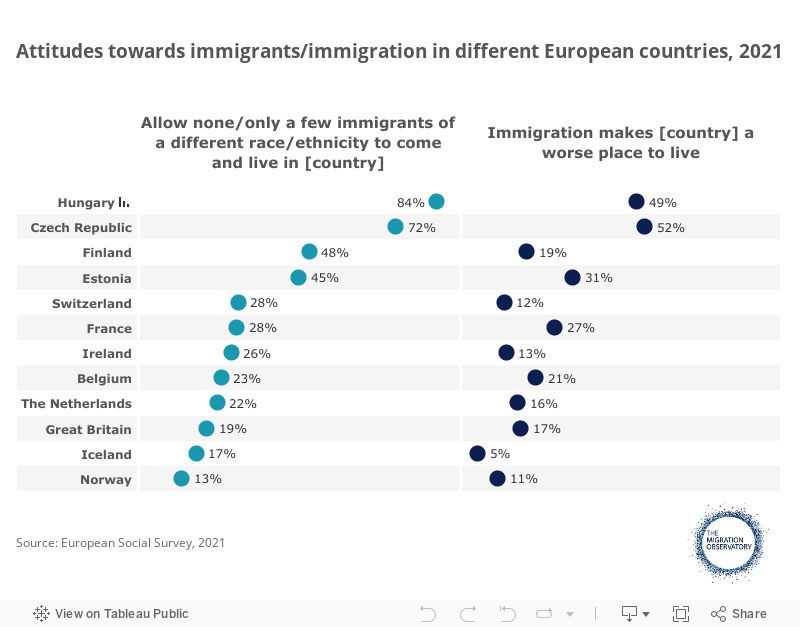
As a further way of characterising countries, we include a second measure based on the percentage of people saying that immigration ‘makes the country a worse place to live’ On this measure, the UK maintains a similar rank position as one of the more positive countries in the sample, and similar to Switzerland at 18%.
These two measures can be thought of as capturing opinions on future migration flows and current population stocks. In most of these 13 countries, it appears that people are more negative towards the idea of continuing flows than about the immigrants already present. Finland, for example, is a country where 42% of the public would prefer few/no immigrants of another race coming to live there, whilst, at the same time, just 19% think immigrants make the country a worse place to live.
Preferences for different types of migrant: origin, similarity, skill level
More specific questions in surveys have revealed that preferences depend on the type of immigrant in question. The ‘type’ of immigrant can be considered in terms of country of origin (which implicitly provides information on religion, language, culture and other indicators of ‘social distance’) but also in terms of the migrants’ skill levels.
British people make clear distinctions between migrants based on their country of origin – see Figure 5. In 2017, just 10% said that no Australians should be allowed to come and live in Britain, compared to 37% saying that no Nigerians should be allowed. In between are migrants from France (similar to Australia), Poland (more middling), and Romania and Pakistan (more similar to Nigeria). Such patterns have sometimes been described as an ‘ethnic hierarchy’ [2]. At the preferred end of the scale are those who are white, English-speaking and from European and Christian countries, while the least preferred are non-white migrants from non-European or Muslim countries. Romania is an interesting anomaly. Despite being a European and Christian country, opposition to immigration from Romania is at similar levels to opposition to immigration from Pakistan. This may reflect an association with the Roma minority [3].
Figure 5
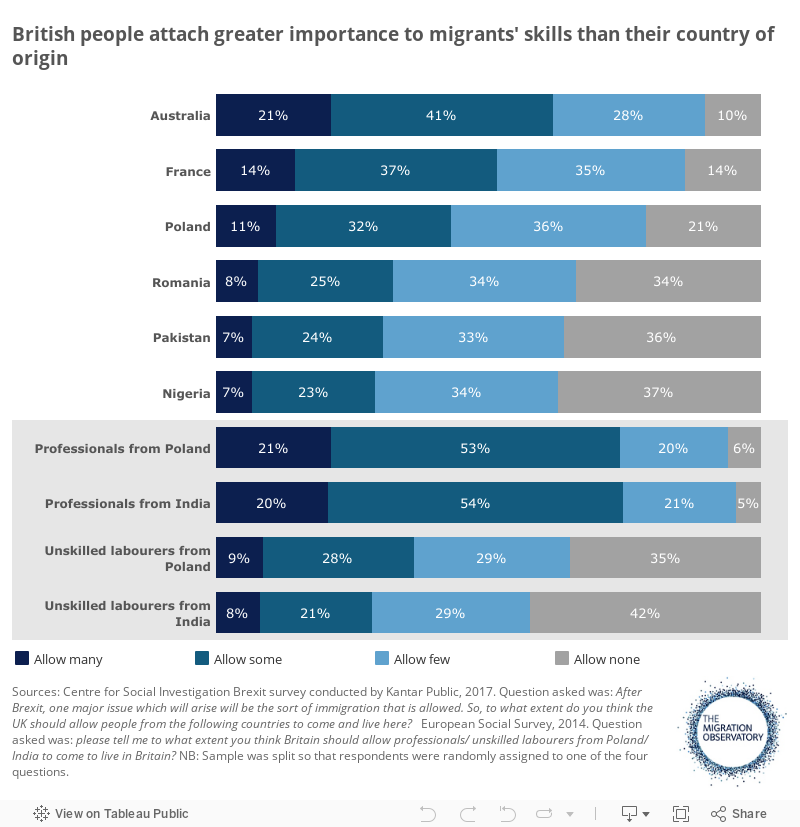
Country of origin is not the only factor that people take into account when considering preferences on immigration. In the European Social Survey 2014, British respondents reported how many immigrants should be allowed based on a question that specified both the country of origin (Poland or India) and the skill level (professional or unskilled labourer). The results revealed that when migrants are professionals, opposition is low, and when migrants are unskilled, opposition is high (Figure 5). Research has shown that people’s general preference for high-skilled over low-skilled migrants is mainly driven by perceptions of their higher economic contribution [4].
Further, when asked about professional migrants, British people do not appear to distinguish between countries of origin. Just 5% say ‘allow no professionals’ from India and 6% for Poland. When it comes to unskilled labour migration, there is a slight preference for people from Poland (35% ‘allow none’) over people from India (42% ‘allow none’). Therefore, figures showing average opposition towards immigration from Poland (21%) mask variation depending on skill level (6% for skilled, 35% for unskilled).
The preference among the British public for highly skilled migrants aligns with previous research indicating that, when questioned about the criteria for incoming migrants, skills are considered more important than other factors such as race/ethnicity and religion [5]. People also make distinctions based on specific occupations and on asylum seeker status – although here, too, the public distinguish by country of origin, as we show below.
As of April 2023, 37% of people thought that the arrival of asylum seekers should be made more difficult, but only 14% wanted to do so for Ukrainians fleeing conflict
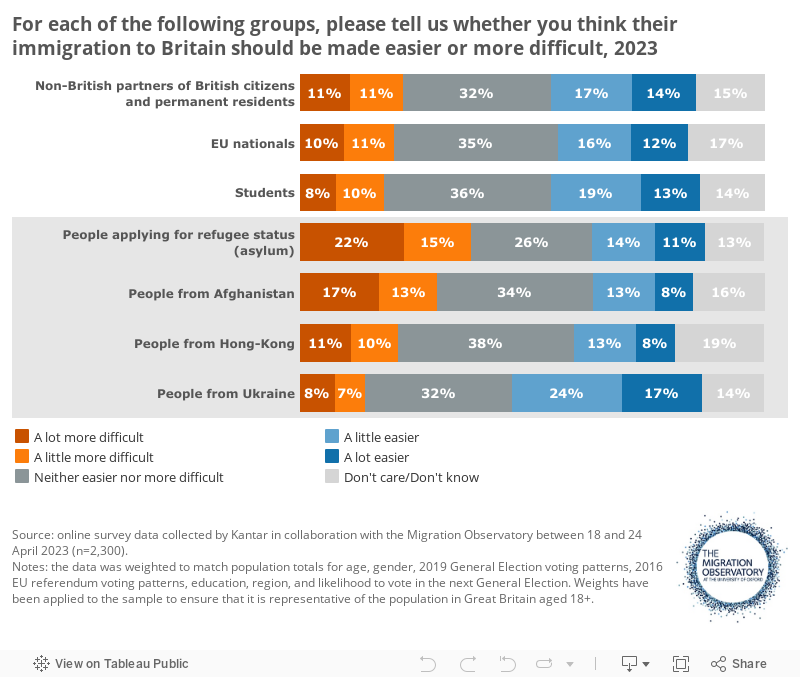
Attitudes towards asylum seekers tend to be more restrictive compared to other groups of people moving to the UK. In April 2023, 37% of the British public said that migration to the UK should be made more difficult for asylum seekers, while this share was lower for Ukrainians (14%), Hong Kongers (21%) and Afghans (30%) (Figure 6). The UK Government’s policy towards Ukrainians fleeing war and Hong Kongers leaving Hong Kong after the passing of China’s National Security Law is more generous than towards other people escaping conflict, including Afghans. People from Ukraine and Hong Kong can freely apply to bespoke visa schemes, while people seeking asylum must first cross to the UK, often irregularly, to be able to apply for asylum.
Admission preferences towards international students, EU nationals and people coming on family visas are relatively liberal, with more people in favour of making their migration to the UK easier rather than difficult (Figure 6).
Figure 6
Over a third of people (36%) think that the migration of low-skilled workers to the UK should be made more difficult, but people have more liberal views when asked about migrants in specific jobs that are considered low-skilled, including care, farm and construction workers
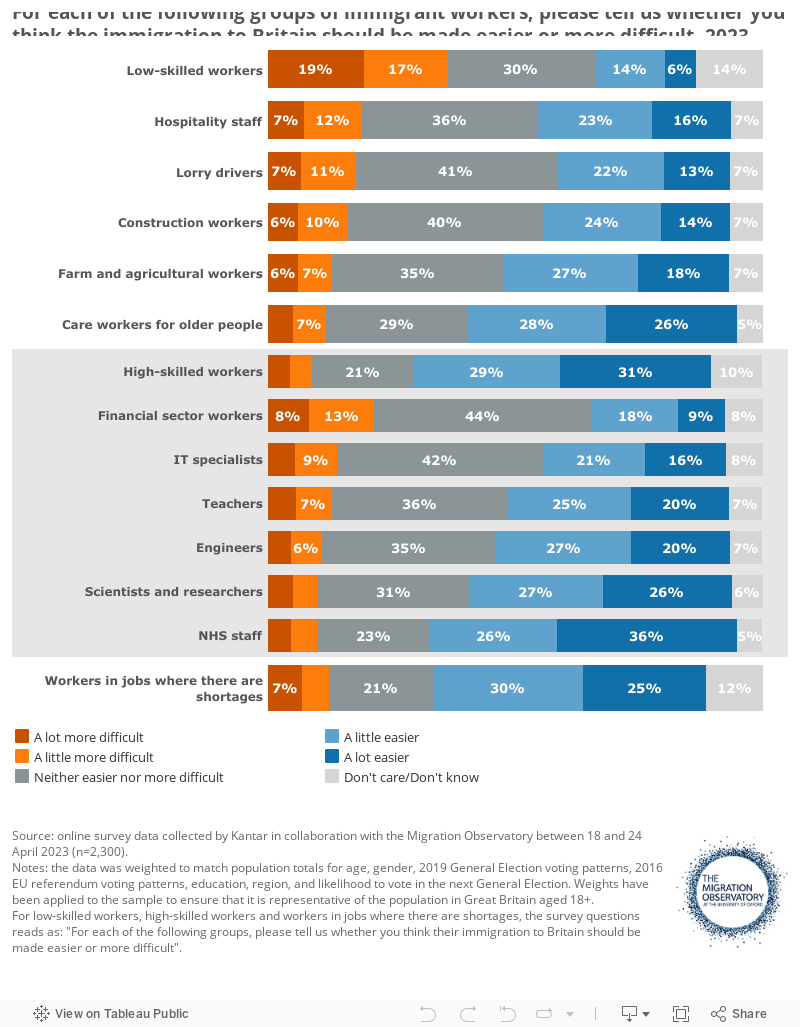
As discussed above, research has shown that public opinion is generally more positive towards migrants with high levels of education or who work in occupations considered high-skilled than towards migrants with lower levels of education or who work in low-skilled jobs [6]. In April 2023, over a quarter of the British public thought that the migration of low-skilled workers should be made more difficult, while this share was of 8% for high-skilled migrant workers (Figure 7).
When people are asked about their preferences for the admission of migrants coming to specific low- and high-skilled jobs, the picture is more complex. The share of people in favour of easing the migration of care, agricultural and construction workers was 54%, 45%, and 38%, respectively, despite the fact that these jobs are often considered low-skilled. By contrast, the share of people in favour of easing the migration of financial sector workers was only 27% despite the fact that these are high-skilled migrants. People’s views about the skill level required to perform a particular job do not necessarily match those of governments and research agencies. Government policies, including labour immigration policies, mostly consider the credentials or level of education required to perform a certain job as the main criteria to classify occupations as low, medium or high-skilled. That is why jobs such as care and agricultural workers are considered low-skilled. In addition, people may consider factors other than skill level, including the social value of workers in certain jobs, such as doctors or teachers.
Figure 7
Younger people and people with university degrees tend to express more positive attitudes towards immigration than older people and people with lower levels of education
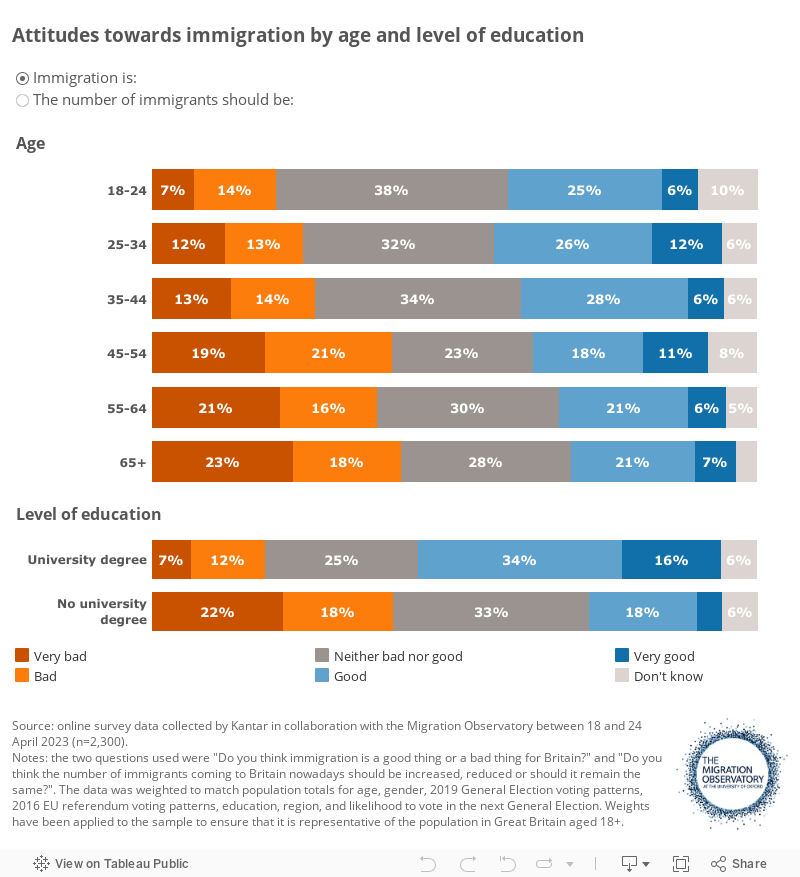
Finally, we focus on how attitudes towards immigration vary between different types of people. We show, in Figures 8 and 9, how opinions vary by age, education, and political preferences. Compared to people over age 45, younger people are less likely to say that immigration is a bad or very bad thing for Britain (25% vs. 4) and that the number of immigrants should be reduced (40% vs. 58%) (Figure 8). Research shows that people do not become more negative towards immigration as they age, as attitudes are quite stable over adulthood [7]. Differences between older and younger people more likely reflect different historical and social contexts in which people have been socialised. For a discussion about the relationship between immigration attitudes and ageing, see Drazanova (2021) [8].
People with university degrees are more likely to think that immigration is a good or very good thing (50%) compared to people with lower levels of education (22%). University-educated people are also less likely to think that immigration should be reduced (37%) than people with lower levels of education (59%). Multiple factors explain why highly educated people tend to express more liberal attitudes towards immigration in surveys, including holding more cosmopolitan [9] or nationalistic views [10], being more susceptible to social desirability bias (that is, hiding their views when these are not socially acceptable) [11] [12], or being less affected by labour market competition with migrants [11]. Note that there is some overlap between people’s age and level of education; for example, among those above 54, 24% have a university degree, while this share is higher (37%) among younger people.
Figure 8
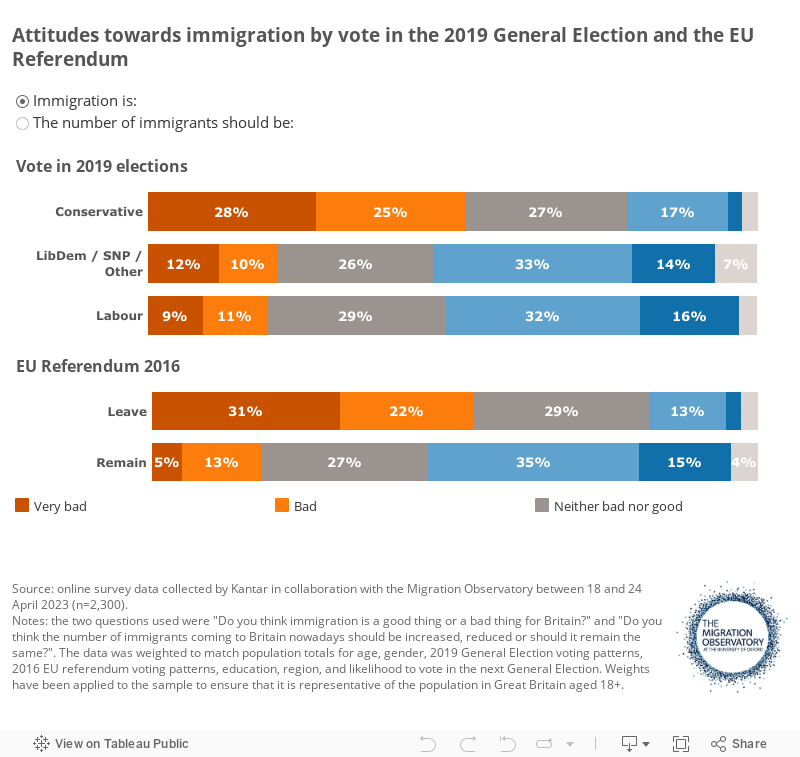
Labour voters tend to express more positive attitudes towards immigration than Conservative voters
People who voted Labour in the 2019 General Election are more likely to say that immigration is a good or very good thing for Britain (48%) compared to Conservative voters (19%) (Figure 9). Labour voters are also less likely to say that immigration numbers should be reduced (37%) than people who voted Conservative (74%). There is a correlation between age –– which, as discussed earlier, is one of the main factors associated with immigration attitudes –– and voting behaviour. Conservative voters are, on average, older than Labour voters, and older people are more likely to vote Conservative than younger people.
Brexit is still a major divide in British Society. Leave voters and remain voters had different visions for the future of the United Kingdom, and immigration played a key role in those visions. People who voted remain in the EU Referendum are, on average, more socially liberal and pro-immigration, while leave voters are more socially conservative and anti-immigration. It is now also well established that older people tend to be less favourable towards immigration and more likely to have voted for Britain to leave the EU, while those with more education are more pro-immigration and more likely to have voted remain [12]. Based on the Migration Observatory’s 2023 online survey with Kantar, there is a substantial overlap between voting patterns at the 2019 General Elections and the EU Referendum in 2016. For example, 63% of Labour voters voted for Remain, while 23% of Conservative voters did so (note this is based on self-reported data on past voting behaviour).
Figure 9
Evidence gaps and limitations
Some of the evidence base comes from questions about ‘immigrants’ or ‘immigration’, terms which are defined vaguely or not at all and likely to be envisioned differently in the minds of different respondents [1]. While official government statistics on net migration define a long-term international migrant as anyone who comes to the UK to stay for at least one year, it is not clear whether or how the public distinguishes migrants from others such as short-term visitors, naturalised British citizens, children of migrants who are native-born British, and ethnic or religious minorities generally. Furthermore, in a media environment that often conflates categories such as refugees, asylum seekers, and migrants [13], there is a danger that survey respondents’ expressed opinions are based on an image of immigration that highlights only a subset of the full array of migrants to the UK.
Endnotes
[1] Blinder, S. (2015). Imagined immigration: The impact of different meanings of ‘immigrants’ in public opinion and policy debates in Britain. Political Studies, 63(1), 80-100.
[2] Ford, R. (2011). Acceptable and unacceptable immigrants: How opposition to immigration in Britain is affected by migrants’ region of origin. Journal of Ethnic and Migration studies, 37(7), 1017-1037.
[3] Allen, W. (2014). Bulgarians and Romanians in the British National Press, Migration Observatory Report, University of Oxford.
[4] Igarashi, A., Miwa, H., & Ono, Y. (2022). Why do citizens prefer high-skilled immigrants to low-skilled immigrants? Identifying causal mechanisms of immigration preferences with a survey experiment. Research & Politics, 9(2).
[5] Heath A and Richards L. (2018). Contested boundaries: consensus and dissensus in European attitudes to immigration, Journal of Ethnic and Migration Studies, 46:3, 489-511.
[6] Ford, R., and Mellon, J. (2020). The skills premium and the ethnic premium: a cross-national experiment on European attitudes to immigrants. Journal of Ethnic and Migration Studies, 46(3), 512–532
[7] Kustov, A., Laaker, D., & Reller, C. (2021). The stability of immigration attitudes: Evidence and implications. The Journal of Politics, 83(4), 1478-1494.
[8] Drazanova, L. (2021). Are older people more hostile towards immigrants? Migration Policy Centre Blog, EUI Robert Schumann Centre.
[9] Igarashi, H., & Saito, H. (2014). Cosmopolitanism as cultural capital: Exploring the intersection of globalization, education and stratification. Cultural Sociology, 8(3), 222-239.
[10] Lee, B. (2023). Educational Content, Exclusive National Identity, and Anti-Immigrant Attitudes. Journal of Politics. Available online
[11] Hainmueller, J., & Hopkins, D. J. (2014). Public attitudes toward immigration. Annual review of political science, 17, 225-249.
[12] Hobolt, Sara B. (2016). The Brexit vote: a divided nation, a divided continent. Journal of European Public Policy, 23 (9), 1259-77.
[13] Baker, P., Gabrielatos, C., Khosravinik, M., Krzyżanowski, M., McEnery, T., & Wodak, R. (2008). A useful methodological synergy? Combining critical discourse analysis and corpus linguistics to examine discourses of refugees and asylum seekers in the UK press. Discourse & Society, 19(3), 273-306.