
Based on official population estimates and population projections, this briefing examines the impact of migration on recent and future UK demographic trends.
-
Key Points
- More than half (60%) of the increase in the UK population between 2004 and 2022 was due to the direct contribution of net migration.
More… - Official figures projected that the UK’s population would grow from 67 million in 2021 to 77 million in 2046, and that net migration would account for 92% of this growth. In an alternative variant where net migration was zero, the population would be lower in 2031 than it was in 2021.
More… - Projected population growth is faster in England than in the other UK nations. Scotland and Wales would experience population decline without future net migration, whereas natural change (births minus deaths) is projected to be the main driver of future population growth in Northern Ireland.
More… - Net migration assumptions have been continually revised in the projections released since the mid-1990s, reflecting rising levels of net migration and the high uncertainty of migration forecasting.
More…
- More than half (60%) of the increase in the UK population between 2004 and 2022 was due to the direct contribution of net migration.
-
Understanding the Policy
The UK does not have an explicit population policy. However, immigration policy decisions affecting people who come to the UK for work, study, family or humanitarian reasons all indirectly affect net migration and this in turn affects population growth. ... Click to read more.The level of net migration has been an important factor in immigration policy debates over the past 20 years. During the early 2010s, for example, the government had a target to reduce net migration to the UK “from the hundreds of thousands to the tens of thousands” – although this target was not met.
Immigration policy is not the only thing that affects net migration. Net migration can change even when policies stay the same. This is because many other factors affect who migrates to and from the UK, such as economic prospects in the UK and in countries of origin, changes in the global market for international study, or conflicts that produce refugees.
-
Understanding the Evidence
In the UK statistical system, long-term international migrants are defined as people who move into and out of the country for at least 12 months. Net migration is the balance between immigration and emigration over a given time period. ... Click to read more.In demographic terms, natural change—i.e., the difference between the number of births and deaths—measures the contribution of vital events to the population dynamics. Immigration and emigration contribute to population change both by altering the number of individuals in the country at a given time (direct contribution) and by affecting natural change (indirect contribution).
Population estimates
The Office for National Statistics (ONS) produces annual estimates of the resident population of England and Wales and estimates for the UK as a whole by collating data provided by the Northern Ireland Statistics and Research Agency (NISRA) and by the National Records for Scotland (NRS). The population at 30 June of a given year (stock) is obtained by annually ‘updating’ the most recent census population count with data on demographic events contributing to population change between these two dates (births, deaths and migration flows). Population estimates made between census years are revised retrospectively to provide a consistent series of population estimates over time. For example, the revised estimates for the period between the 2001 and 2011 censuses resulted in an adjustment of 497,500 (0.8%), primarily due to the underestimation of net migration in the previous series. Mid-year population estimates are also used as the base-year population of demographic projections.
Population projections
Population projections are calculations showing the future development of a population based on a set of assumptions about fertility, mortality and net migration. Official UK projections are usually revised every two years by updating base-year population estimates and assumptions underlying future demographic dynamics to reflect the latest available information. The Covid-19 pandemic disrupted the usual schedule and publications, however.
The most recent full set of projections—including variants to assess the impact of higher or lower net migration—used mid-2018 as the beginning of the projection period. In these projections, ONS provides a principal projection reflecting the ‘most likely’ population developments based on recently observed trends, as well as a number of variant projections intended to capture the uncertainty of the assumptions by showing the impact on population dynamics if one or more components of demographic change differ from the principal projection. For comparative purposes, an important variant projection is ‘zero net migration’ (aka ‘natural change only’), which assumes migration inflows and outflows are equal at all ages throughout the projection period (with the same fertility and life expectancy as the principal projection). In this scenario, future population change is driven only by births and deaths. The comparison between the principal projection and the zero net migration variant allows one to assess the overall impact of net migration on population trends – i.e. including both the direct contribution and its impact on natural change.
In 2022, the ONS published updated projections based on 2020 data but did not include any variants. It then updated this 2020-based projection in light of unexpectedly high net migration estimates, publishing a new projection in January 2023 and produced a 2021-based projection in January 2024. This most recent principal projection assumes that net migration will level off at 315,000 per year from 2027-8 onwards. This figure represents the estimated 10-year average net migration preceding the most recent projection. The net migration assumption was increased from 205,000 per year in the January 2022 projection, following an ONS review of its methodology.
Net migration exceeded natural change for most of the past two decades
Population estimates show that net migration was a major component of population growth over the past two decades (Figure 1), making up 60% of population growth from 2004 to 2022. Natural change—i.e. the difference between the number of births and deaths—has remained positive throughout the last two decades but has fallen since 2011.
Figure 1
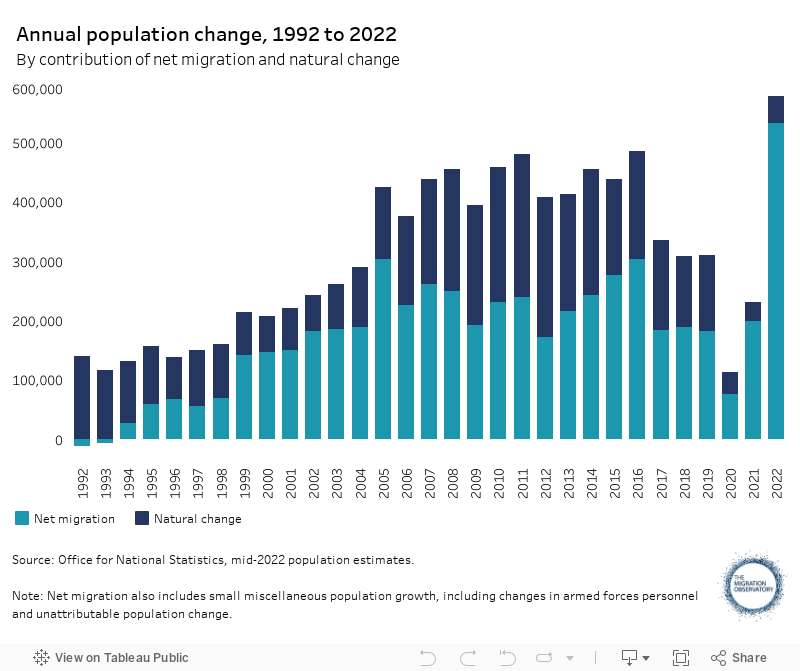
This retrospective analysis does not account for the contribution of past migration to natural change – mainly to births. The number of births over a given period is determined by the size and age structure of the female population and by fertility rates (i.e. the average number of children per woman in each age group). Migration affects both. That is, it affects the number of women of childbearing age and, if migrant women have different fertility patterns, the total fertility rate of the population as a whole.
ONS figures show that in 2022, 30.3% of births in England and Wales were to non-UK born mothers. This is higher than the share of non-UK born people in England and Wales, primarily because non-UK born women are more likely to be of childbearing age. The estimated total fertility rate of foreign-born women living in England or Wales has declined over the past ten years to just below the ‘replacement rate’ and stood at 2.03 in 2021, the latest year with available data. This compared to 1.54 for UK-born women. Note that these figures include non-UK born women regardless of how long they have lived in the UK.
The UK population is projected to grow to approximately 76.6 million by mid-2046
The most recent population figures from the Office for National Statistics projected that the UK population would grow to 76.6 million by mid-2046 (Figure 2). They assumed that net migration would average 315,000 in the long term, starting from mid-2027, i.e. a decline from the unusually high net migration levels seen immediately after the pandemic. The projected rate of growth between mid-2021 and mid-2046 (14.2%, equivalent to 9.5 million people) is lower than the rate of growth seen in the previous 25 years, from mid-1996 to mid-2021 (15.2%).
Figure 2
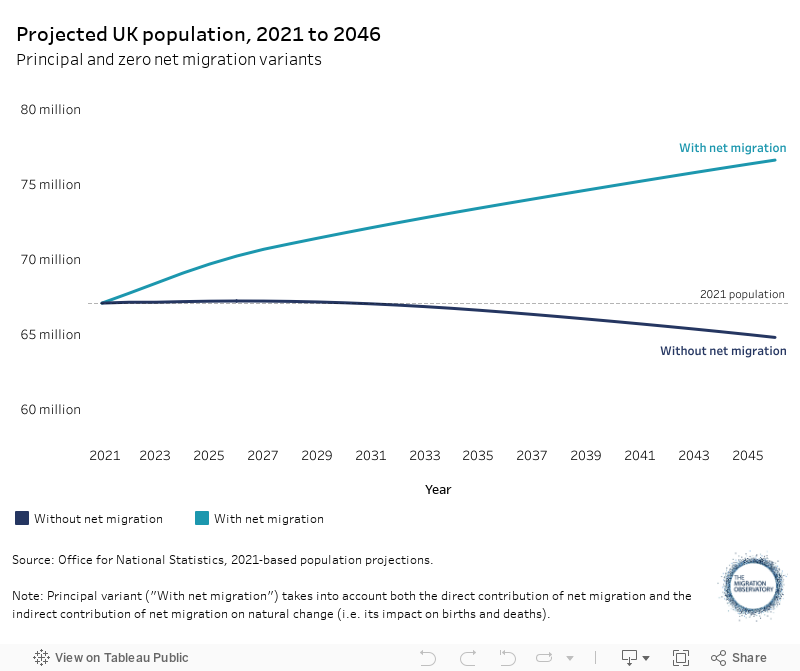
The projected population increase from the 2021-based projections can be broken down into three components: the natural change that would occur if net migration was zero during the projection period; the direct contribution of post-2021 net migration (i.e. the number of individuals who will migrate to the UK minus the number of those who will leave the country); and the indirect contribution of post-2021 net migration, i.e. its effect on natural change.
In their principal projection (Figure 2, With net migration), ONS projected that the UK population would grow by 6.6 million between 2021 and 2036. Net migration accounted for 92% of this growth (6.1 million). The contribution is higher if one also includes the impact of future migration on births and deaths in the calculation. By contrast, the population would be lower in 2031 than in 2021 if net migration were zero (Figure 2, Without net migration). This is because natural change (i.e. births minus deaths) was projected to be negative from 2027.
However, ONS population projections are sensitive to different assumptions about net migration. In their 2018-based projections, for example, the UK population after 25 years was projected to be 2.7 million (or 4%) higher in a scenario where net migration was 290,000 per year, compared to its central scenario, which assumed net migration of 190,000 per year.
Scotland and Wales would experience population decline without future net migration
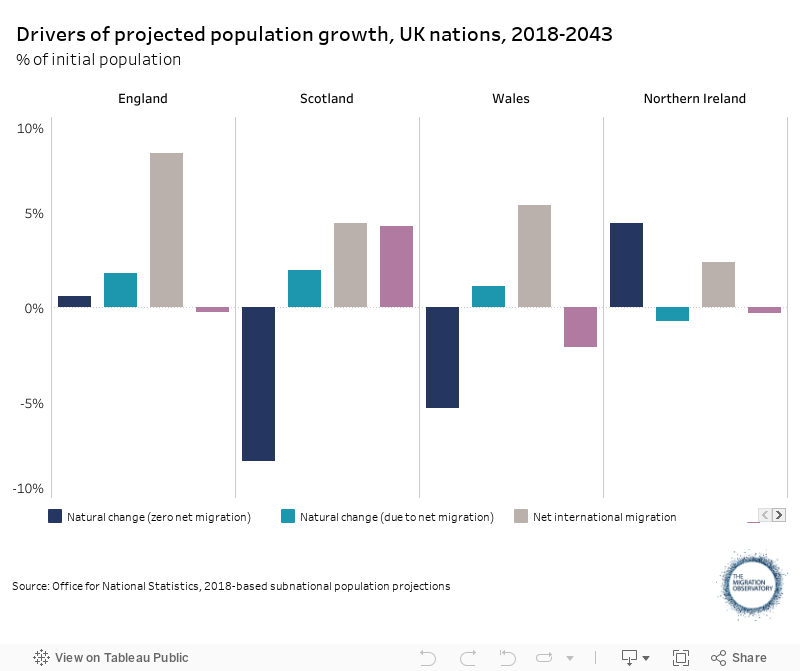
Demographic and migration trends differ considerably across the four UK constituent nations, and future population scenarios reflect these differences. According to the ONS’s 2020-based principal projection, published in January 2023, England would experience the fastest population growth, at 9% over the 25-year forecast period. Wales and Scotland were projected to have slower rates of increase, at 5% and 1% respectively.
To understand the impacts of net migration, we must return to the 2018-based population projections (Figure 3). In England and Wales, net international migration was projected to make the largest contributions to population change by 2043 (+8% and +5%, respectively). Scotland would experience considerable population decline (-8%) in the absence of net international migration, and it is also the nation that receives the highest percentage population growth due to cross-border migration from other parts of the UK. By contrast, natural change without net migration is projected to be the main driver of future population trends in Northern Ireland (+4%), due to its higher fertility rate.
Figure 3
Evidence gaps and limitations
Population projections are not forecasts. They do not attempt to predict the impact of political, economic, social and cultural changes which may affect demographic patterns and trends, but are mechanical calculations that show the outcomes of sets of assumptions made for the three components of demographic change (fertility, mortality and migration). Projections are typically reliable for the short to medium term, with the exception of periods of shock such as the Covid-19 pandemic. Uncertainty increases the further the projections are carried forward in time, as any upward or downward changes in fertility, mortality and migration assumptions, compounded over time, can lead to significant variations in the projected population size and structure.
Future international migration is more difficult to project than fertility and mortality because migration flows are often affected by sudden changes in economic, social, or political factors which are hard to predict or quantify, such as the sharp increase in net migration due in part to the war in Ukraine and high vacancy rates in the health and care sector. Migration assumptions are, therefore, the major source of uncertainty for long-term population projections, particularly in demographic regimes such as the UK, which are characterised by below replacement fertility and low mortality levels. For more discussion on projections of future net migration, see the Migration Observatory briefing, Net migration to the UK.
In each revision of population projections, assumptions of future levels of fertility, mortality and migration are updated to reflect the most recently observed demographic trends. This has resulted in sizeable revisions in different sets of population projections released, particularly throughout the 1990s and 2000s. In the 1994-based principal projection, for example, net migration was assumed to return to zero in the long term, reflecting the levels of net migration observed during the 1980s and early 1990s. As a result, the size of the UK population was projected to peak at 61 million in 2023 and then start to decrease (Figure 4).
Figure 4
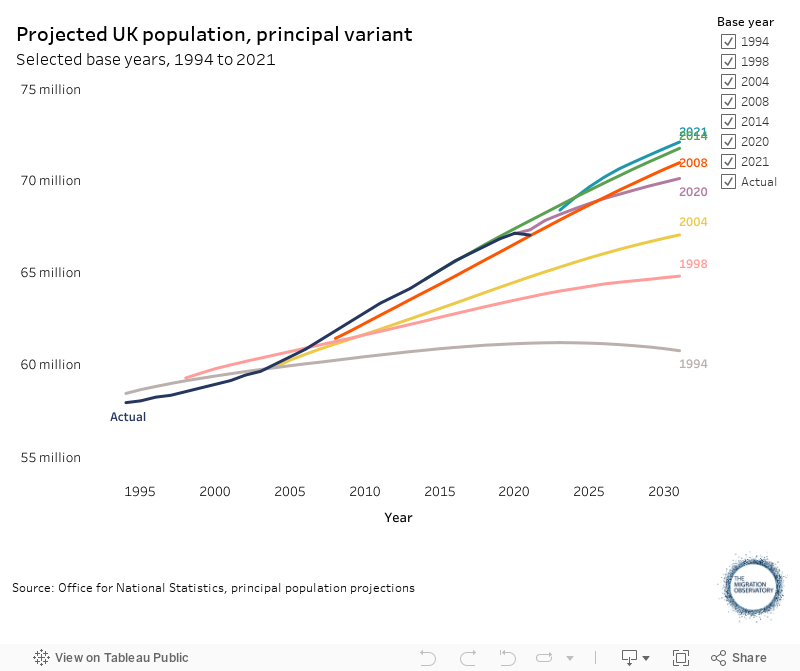
In the subsequent projections, upward revisions of assumed net migration levels were introduced to reflect the rapid increase in migration flows to and from the UK. As a result, projected population growth rates have also increased. In the latest revision (2021-based, published January 2024), the projected size of the UK population in 2031 was around 11 million higher than in projections produced in the mid-1990s.
The ONS does not attempt to model the impact of policy changes when setting its migration assumptions. Therefore, its population projections do not reflect a prediction about how current policy will affect future net migration.
References
- ONS, 2023. Population estimates for England and Wales: mid-2022. Newport: ONS. Available online.
- ONS, 2024. National population projections: 2021-based interim. Newport: ONS. Available online.
-
Media Coverage
-
Financial Times (27 May 2016)
Soaring population driven only in part by migrants
-
Financial Times (27 May 2016)