
This briefing covers the scale of immigration and net migration in the UK since the early 2000s and under the post-Brexit immigration system.
-
Key Points
- The UK has experienced broadly similar levels of migration compared to other high-income countries, on average, over the past few decades.
More… - Net migration was 204,000 in the year ending June 2025, similar to the levels seen during the 2010s, but a sharp decline from the unusually high levels in 2022 and 2023. In the year ending June 2025, 69% of non-EU immigration was for work and study purposes.
More… - EU citizens made up a majority of immigration and net migration in the run-up to the 2016 EU referendum. Since 2022, however, EU net migration has been negative, according to official estimates, with 70,000 more people leaving than arriving in the year ending June 2025.
More… - While the emigration of international students has been rising, they became more likely to stay in the UK since Brexit, contributing more to net migration than they had done in the past.
More… - There is net emigration of British citizens, with more leaving than returning. In the year ending June 2025, this was estimated at 109,000, although the figures are highly uncertain. It is also unclear whether this figure is high or low by historical standards, because it is not comparable with pre-pandemic estimates of British net migration.
More… - Projections of future net migration are inherently uncertain. In the past 20 years, official projections have usually underestimated future net migration levels.
More…
- The UK has experienced broadly similar levels of migration compared to other high-income countries, on average, over the past few decades.
-
Understanding the Policy
The scale of UK migration is affected by immigration policies but also depends on other factors such as the state of the economy here and in countries of origin, demand for international study opportunities, and events and crises around the world. ... Click to read more.Immigration policies tend not to specify the total number of people who can move to a country, but simply set eligibility criteria to determine who can qualify for residence. The number of people who meet the criteria will fluctuate over time, even when policy does not change. This is one reason it is difficult for politicians to specify exactly what level of net migration they expect in future.
During some periods, specific numerical targets in immigration policy have been in place, however. In particular, the Conservative-led UK governments from 2010 to 2019 had explicit targets to reduce net migration – immigration minus emigration – to under 100,000 a year. In the early 2010s, several policies were introduced to help achieve this target. The net migration target was never reached and was abandoned at the end of 2019 under Boris Johnson’s government. The Labour government elected in 2024 has said that it does not want to set a target for net migration.
In January 2021, a new immigration system was introduced to replace free movement. Under the new system, EU citizens migrating to the UK have been subject to the same immigration rules as citizens from the rest of the world (though Irish citizens continue to have free movement rights under separate legal arrangements). An annual cap on skilled workers was also removed. Projections made before this system came into force suggested that it would reduce overall migration, compared to a system in which free movement had continued. These projections did not account for other factors that affect migration trends, such as the war in Ukraine and the establishment of a route for Hong Kong British National Overseas (BNO) status holders; and they did not anticipate the substantial increase in demand for migrant workers in the health and care sector post-Brexit, or the introduction of long-term work visas for care workers in early 2022.
Initially, the new immigration system was considerably more restrictive towards EU citizens and somewhat less restrictive towards non-EU citizens, compared to the system that existed until the end of the post-Brexit transition period in December 2020. In early 2024, however, the previous Conservative government introduced a suite of policies designed to restrict immigration via several regular routes. They included higher salary thresholds for work and family migrants and restrictions on the dependants of newly arriving students and care workers.
In May 2025, the Labour government announced a range of further restrictions on visas, including the closure of the care worker route to new overseas recruitment. Home Office analysis estimated that the changes would reduce visa grants by 98,000.
-
Understanding the Evidence
Broadly speaking, there are three main measures of the scale of migration to the UK: ... Click to read more.- Long-term immigration: includes anyone moving to the UK for at least 12 months. This measure is useful because it excludes very short-term migrants, such as those who come on work visas for just a few weeks or months.
- Net migration: is calculated as long-term immigration minus long-term emigration (i.e., those moving for at least a year in either direction). It shows the contribution of migration to population growth.
- Visa grants: include anyone receiving a visa to live or work in the UK, including those who move for very short periods (although we exclude visitor and transit visas from all the data in this briefing). Visa data only cover people who require visas, which means that before the end of 2020, EU citizens were not included in the figures. This means they can only be used to look at changes in migration since the pre-Brexit or pre-pandemic period for non-EU citizens.
The Office for National Statistics (ONS) have produced different estimates of both long-term immigration and net migration, using different data and methods. In this briefing, we provide the overall story by looking at the different data sources together. The three main methods are as follows:
Experimental estimates using administrative records
ONS has recently developed new methods of measuring migration using administrative data. These include tax and benefits records contained in the Registration and Population Interaction Database (RAPID) and Home Office data on visas granted and entries and exits at the border. These data sources have the potential to improve migration statistics, but are not yet labelled National Statistics as they have important limitations.
For non-UK citizens, recent ONS estimates rely on border data. People who enter the UK and remain for at least 12 months, excluding short trips abroad, are counted as long-term immigrants. Those who leave for at least 12 months are counted as long-term emigrants. For estimates based on the most recent data, ONS cannot yet confirm whether people who leave do so for at least 12 months. As a result, it must make assumptions about how long people will stay. These may not be accurate when behaviour is changing, for example, due to policy changes. This is why provisional estimates can be substantially revised over time.
Border data only meaningfully covers non-UK citizens. Estimates of British citizens thus currently rely on RAPID, a database of individuals’ interactions with the tax and benefits system. Understanding British immigration and emigration using the RAPID database requires assumptions about whether people absent from the data have actually left the UK. These assumptions will affect the estimates. The RAPID data will not include people who do not work or receive benefits. Children and students are not counted in the RAPID data either, but in recent migration estimates, ONS has made an adjustment to include them.
Experimental ONS estimates also include asylum applicants and resettled refugees. Arrivals are estimated using internal Home Office data on the asylum applications and grants of status for resettlement, with an adjustment made to avoid the double-counting of those who applied for asylum after entering the country on a long-term visa. The number of departures is sourced from Home Office data on voluntary and enforced returns of asylum seekers. This category does not include immigration or emigration of people who arrive through irregular routes and never go on to claim asylum, because their numbers are not known.
Immigration and net migration figures based on the International Passenger Survey (IPS)
The main source for immigration and net migration data before the COVID-19 pandemic was the IPS, which had many flaws and limitations but provided a long-term view of changes in migration patterns over periods of more than a decade. The survey, conducted at ports and airports, was based on respondents’ intention to come to or leave the UK for at least one year. Intentions may not be accurate. Indeed, in August 2019, ONS announced that its Migration Statistics Quarterly Report was being reclassified from National Statistics status to Experimental Statistics, to convey a lower degree of reliability. This move followed analysis showing that certain groups were not being measured accurately. Estimates in this briefing for before 2012 are based on the earlier, IPS-based figures.
The UK has experienced broadly similar levels of migration compared to other high-income countries, on average over the past few decades
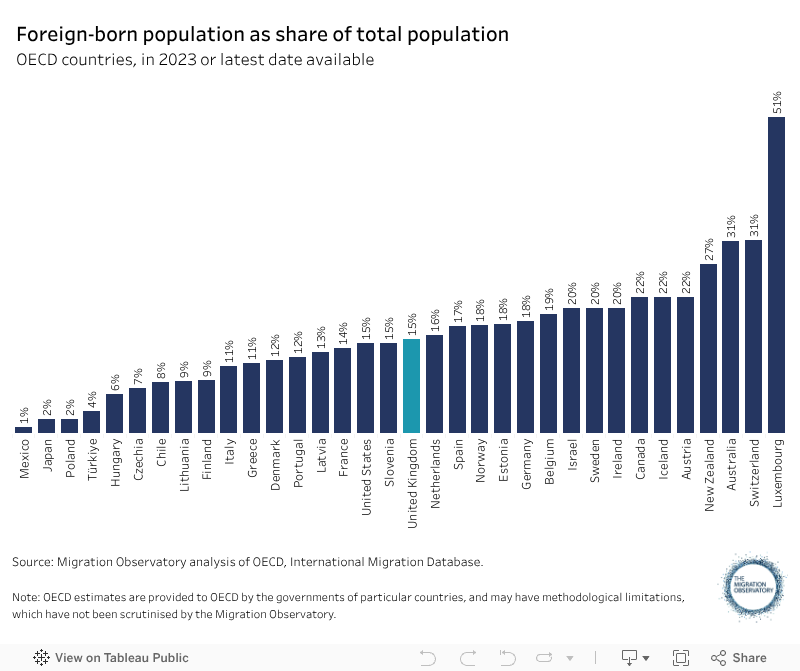
Migration levels fluctuate from year to year, but over long periods, a useful measure of how much immigration a country has experienced is the size of the foreign-born population as a percentage of the population. Countries with high levels of net migration—defined as people immigrating minus those emigrating—develop larger foreign-born or migrant populations over the long run.
According to Census data from 2021/22, the UK’s foreign-born population was 16%. However, OECD data is more informative for the purpose of international comparison since they report more comparable data for a range of countries. The OECD reports that 15% of the UK’s population was foreign-born in 2023, less than the Census figure, because the data source used – the Annual Population Survey – underestimates the migrant population due to survey non-response.
The OECD estimates suggested a similar foreign-born share as in high-income countries such as France and the United States (Figure 1). The UK had a smaller foreign-born population than Australia, Canada, and New Zealand. The foreign-born population in Australia, for example, was roughly double that of the UK as a share of the population. By contrast, the UK had a higher share of foreign-born people in the population compared to Italy, Portugal, and most Eastern European countries, and a much higher share than Japan.
Figure 1
The scale of migration to a country may have some economic impact, but research suggests that for many economic impacts, the composition of migration is more important than the numbers alone. Whether migrants are working and what skills and qualifications they bring are among the key factors that affect the impact of migration on public finances and productivity, for example. For more discussion of the economic impacts of migration, see the Migration Observatory briefings, The Fiscal Impacts of Immigration in the UK, and The Labour Market Effects of Immigration.
Net migration fell sharply in 2024 and 2025 from the unusually high levels seen after the pandemic
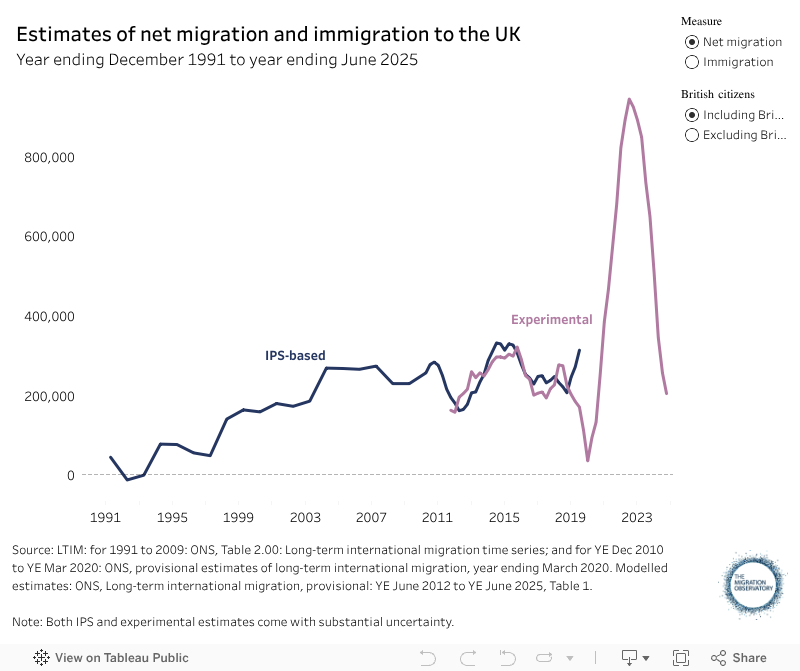
Net migration is a commonly used measure of the overall scale of migration in the UK. It takes into account not just people moving to the country, but also those leaving. This helps understand migration’s contribution to population growth—especially since many people who move to the UK do not remain here permanently. However, the net migration measure also has flaws. For example, it tells us little about who is arriving and leaving or what their impacts are. It can also produce counterintuitive or misleading figures when migration patterns change substantially in a short period, as discussed further below. The UK is unusual in its choice to use net migration in policy debates as the main measure for discussing migration levels. See the Migration Observatory commentary, Net Migration: Frequently Asked Questions, for more information.
Official net migration estimates are currently uncertain, and published figures will be revised. For example, ONS has revised the estimate of net migration for 2024 downwards by 20%, or 86,000, since it was first published. (For more detail, see the Evidence Gaps and Limitations section below.)
With this caveat in mind, estimates from the Office for National Statistics suggest that total net migration was 204,000 in the year ending June 2025. This figure is similar to pre-pandemic estimates but represents a sharp decline compared to the year ending March 2023, when net migration peaked at a historical high of 944,000 (Figure 2).
Figure 2
The sharp rise in net migration after Brexit was driven by an increase in non-EU citizens coming to the UK. This followed policy liberalisations made under the Conservative government. For example, it reintroduced a post-study work route – which likely made the UK more attractive to international students – opened new humanitarian visa routes for Ukrainians and Hong Kongers, and made care and senior care workers eligible for work visas. At the same time, immigration policy also interacted with other factors unrelated to immigration. UK universities recruited students overseas more actively as their financial situation deteriorated, and social care providers hired migrant workers to fill vacancies caused by low pay and poor working conditions in a sector with limited funding.
Net migration fell sharply in 2024, however, after the Conservative government introduced a suite of policies aimed at reducing immigration. These included visa restrictions on the family members of care workers and most international students. Widespread reports of exploitation in the social care sector also led to a Home Office move to scrutinise applications to sponsor migrant care workers more closely.
The ONS estimates that non-EU immigration stood at 670,000 in the year ending June 2025, 37% lower than the same period a year earlier (Figure 3). Just under 70% of non-EU arrivals came to study at UK universities (41%), as a worker (13%), or as the partner or child of a work migrant (13%). Asylum accounted for a further 14% of non-EU immigration—however, unlike other types of migrant, relatively few asylum migrants left the UK, so their impact on population growth will be larger than this. More information on the drivers of work and student migration is available in the Migration Observatory briefings, Work visas and migrant workers in the UK and Student migration to the UK.
Figure 3
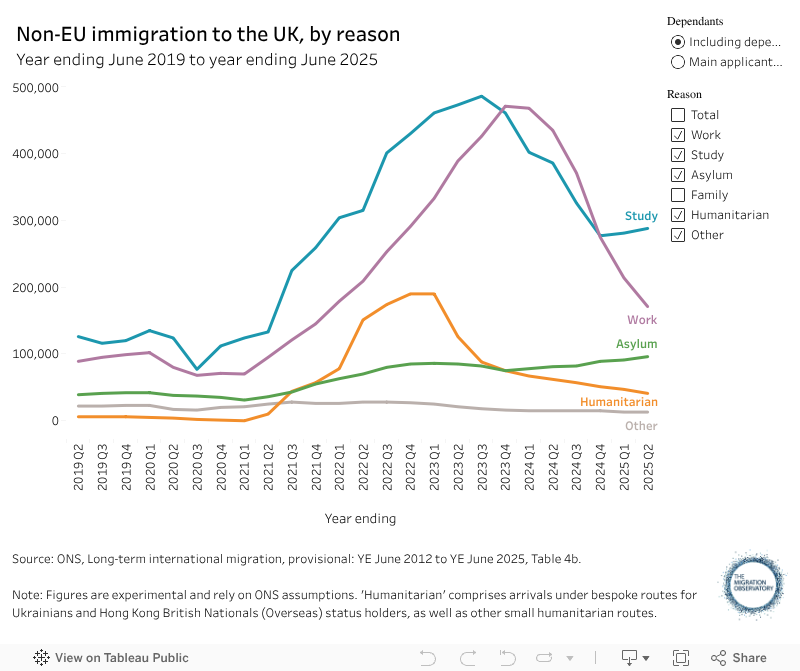
Indian nationals were by far the largest nationality coming to the UK, accounting for 16% of overall immigration, followed by Chinese and Pakistani citizens (7% each).
Net migration of EU citizens was negative in the year ending June 2025
Shortly before the 2016 referendum on EU membership, EU citizens made up the majority of all net migration to the UK (excluding British citizens). Depending on the data source used, EU citizens contributed between 59% and 77% of estimated net migration in the year ending March 2015. This high share was unusual by historical standards and partly resulted from temporary factors: Romanian and Bulgarian citizens receiving full access to the UK labour market in 2014, and migration from Southern European countries where youth unemployment was high due to the Eurozone crisis.
Since the 2016 referendum, the picture has changed (Figure 4). Although policy towards EU citizens did not change until January 2021, EU net migration began to fall immediately after the referendum. Possible explanations for this decline include the economic recovery in southern European countries following the Eurozone crisis; the decline in the value of the pound after the referendum, which made work in the UK less attractive; and uncertainty about the political climate. The decline in the EU share also resulted from rising non-EU migration during the same period.
Figure 4
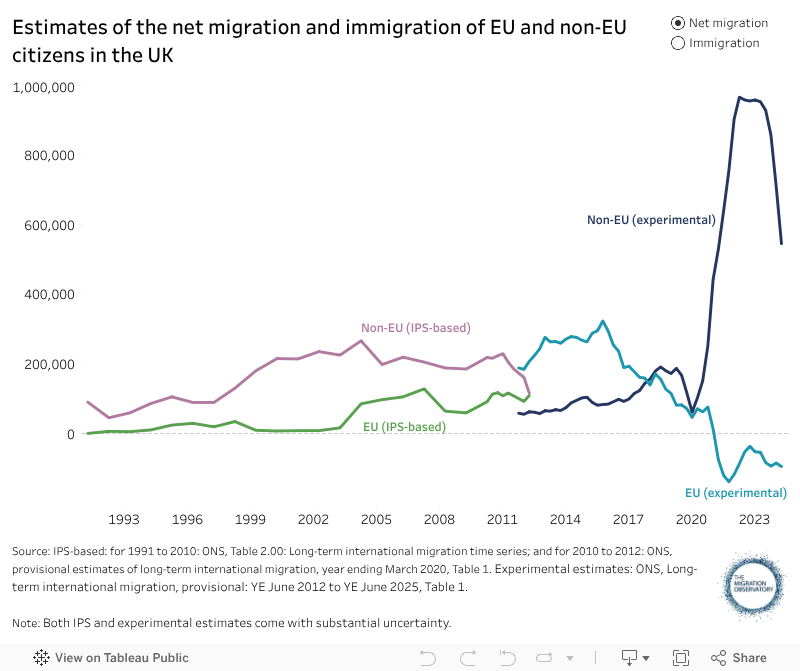
EU net migration subsequently turned negative in 2022, as the post-Brexit immigration system greatly reduced opportunities for EU citizens to move to the UK. Take-up of work visas among EU citizens has been relatively low since Brexit, for example, as explained in the Migration Observatory briefing, Work visas and migrant workers in the UK.
Net migration of EU citizens in the year ending June 2025 was estimated at -70,000. More detail on how EU net migration has changed following the Brexit referendum and COVID-19 pandemic can be found in the Migration Observatory briefing EU Migration to and from the UK.
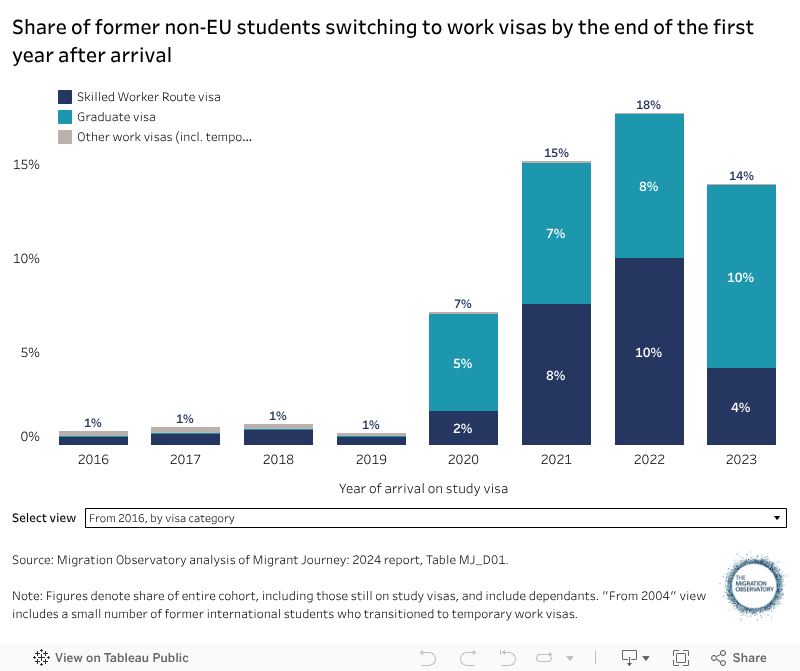
After Brexit, international students started to stay in the UK at higher rates than in the past, contributing more to net migration
In the past, many non-EU citizens—particularly international students—have come to the UK for periods of just a few years before emigrating again. Among non-EU citizens with visas granted in 2008, for example, 83% saw their visas expire by the end of the seventh year after arrival. The resulting emigration subtracts from the overall net migration figure.
Recent increases in study migration have contributed to rising emigration: the estimated number of students emigrating in the year ending June 2025 was almost one and a half times the number emigrating in 2021 (144,000 compared to 49,000). However, there is some evidence that international students became more likely to remain in the UK long term, under the post-Brexit immigration system (Figure 5). This is not just because of the Graduate visa, but also because more students are switching to long-term Skilled Worker visas. As a result, international students have been contributing more to long-term net migration than they did in the past. The decrease in the share of international students switching to long-term work visas in the 2023 arrival cohort may result from restrictions introduced in 2024 that prevented people from switching with their family members into the care worker visa route, and increased salary thresholds for skilled work visas in other jobs. For more information, see the Migration Observatory commentary, International students entering the UK labour market.
Figure 5
Even if a majority of students and workers eventually leave the country, those who remain do, of course, contribute to net migration in the long term and not just the short term. For example, if 500,000 sponsored students arrived in a given year and 20% remained permanently, that annual cohort would contribute 100,000 to net migration over the long term.
Students’ temporary stays have previously generated debate about whether they should be included in net migration statistics. Net migration data are used to generate population estimates, and since students are part of the population, removing them from the UK’s main net migration figures would make population estimates less accurate. Other countries routinely include students in their net migration statistics, including Australia, Canada, the United States and New Zealand. One difference between the UK and other countries is that UK policy debates focus more on net migration (and thus are more affected by idiosyncrasies of the net migration measure), while debate in other countries tends to focus on immigration and grants of temporary or permanent status.
There was a net emigration of British citizens in the year ending June 2025
In the year ending June 2025, net emigration of British citizens was estimated at 109,000 (Figure 6), using an experimental new methodology that makes the figures particularly uncertain. It is unclear how this compares to pre-pandemic trends because the methodology is different (see Understanding the evidence for more information). However, ONS estimates dating back to 1964 indicate that British net migration has been negative in all but one year (1985).
Figure 6
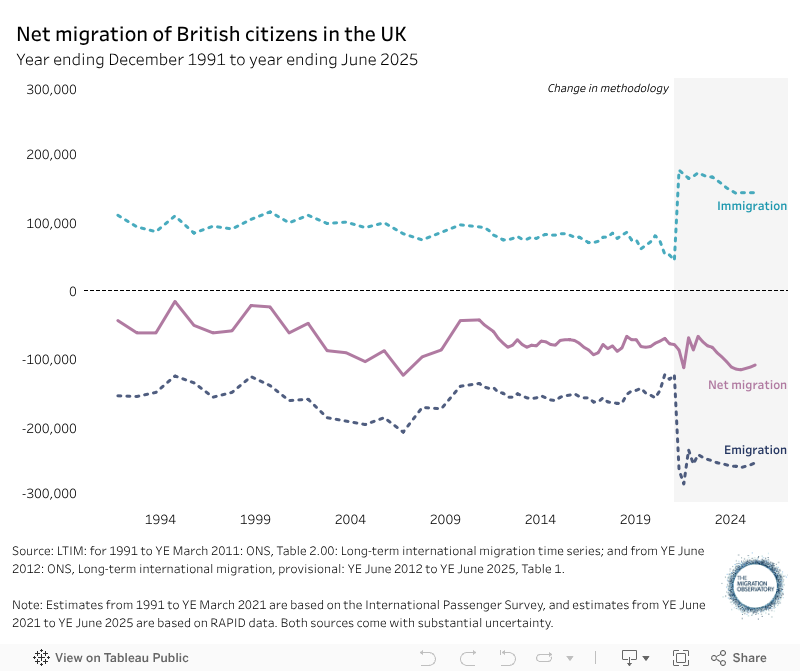
Relatively little is known about which British citizens leave the UK, or the reasons why. A little under 70% of British emigrants in the year ending March 2025 were estimated to be aged between 16 and 34, reflecting the fact migration is usually concentrated among younger people. Qualitative research has found that they often move for career or lifestyle reasons.
According to United Nations population estimates, 4.8 million British citizens were living overseas in 2024, with just over half living in either Australia (23%), the United States (19%), and Canada (9%). More recently, between 2020 and 2024, the countries which saw the biggest increase in their British populations were Poland, Malta, and Romania. One reason may be that EU migrants are returning home, joined by British family members.
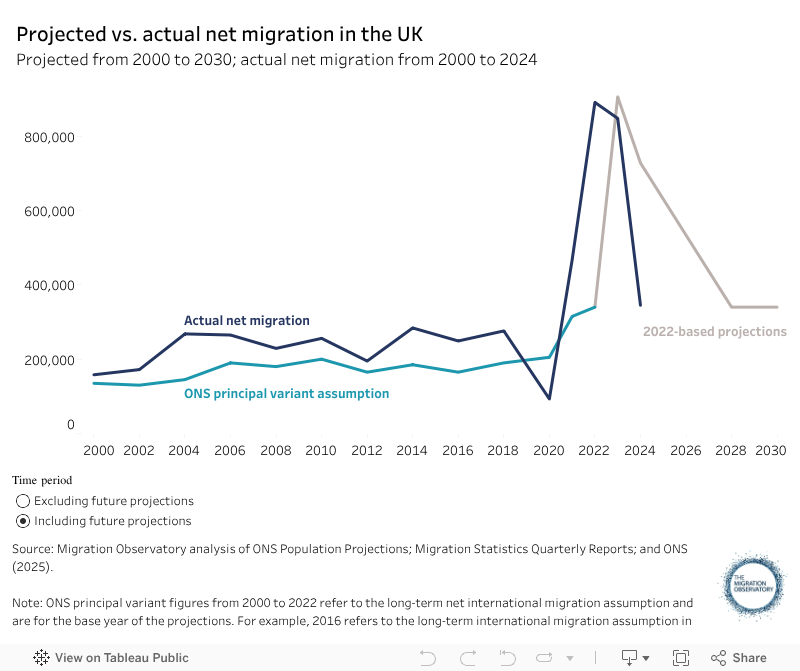
Projections of future net migration are inherently uncertain
ONS produces population projections that are used for planning services and making public finance forecasts, among other things. This requires assumptions about future net migration. Making these assumptions is difficult because migration patterns depend on many different factors, both within and beyond government policy. ONS assumptions typically have not taken into account migration policy announcements or political intentions, but instead are based on historical migration and consultations with academic experts.
In its most recent population projections, produced in early 2025 and based on 2022 data, ONS assumed that net migration would fall to an average long-term level of 340,000 by 2028.
Net migration assumptions contained in population projections over the past twenty years have usually undershot (Figure 7). For example, net migration was an estimated 229,000 in 2008. The 2008-based population projections assumed that net migration would fall to 180,000 within a few years, but it remained persistently above 180,000, with a brief exception in 2012. Another exceptional year was 2020, when the COVID-19 pandemic unexpectedly reduced net migration. For a further discussion of ONS population projections, see the Migration Observatory briefing, The Impact of Migration on UK Population Growth.
Figure 7
One reason net migration projections have often been too low is that they usually assume net migration will be similar to previous trends over a long period. This will mean the projections will be too low when migration levels are on an upward trajectory, as has generally been the case since the late 1990s. More recent ONS projections take a shorter period of historical data (10 rather than 25 years), which might help to address this problem.
Evidence gaps and limitations
When producing the most recent year of data, ONS relies on assumptions about future travel patterns that are necessarily uncertain. As a result, provisional estimates are sometimes revised substantially. In particular, ONS must make assumptions about the share of people granted long-term visas who will not remain in the UK for the full duration of their visa, but migration behaviours have changed following the introduction of the post-Brexit immigration system. ONS thus faces a trade-off between timeliness and accuracy of its provisional statistics.
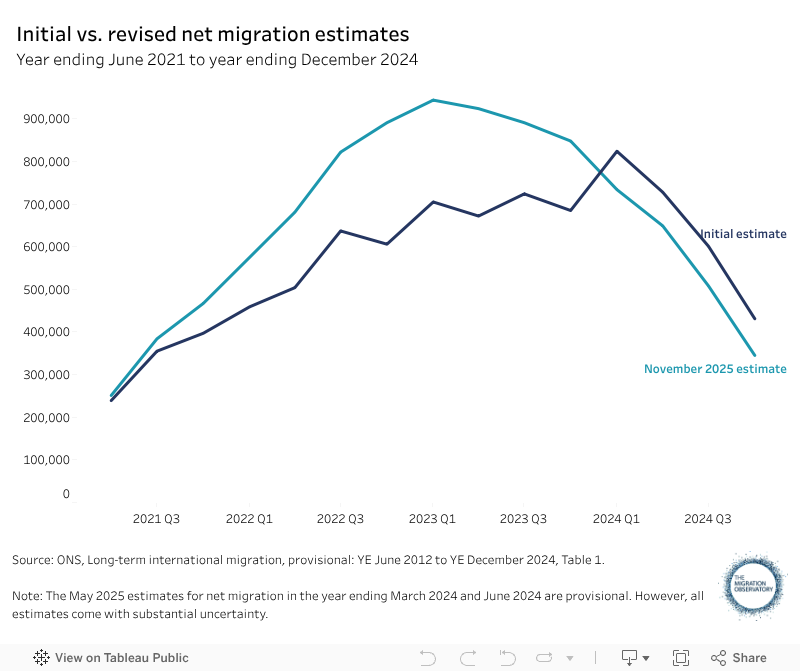
Net migration publications also provide revised estimates for previous years, using more complete travel data. Due to both changing mobility patterns and one-off factors, including improvements in the methods and data used, substantial revisions were made to net migration estimates between 2022 and 2024.
The November 2025 publication made further revisions, primarily because the method used to estimate EU and British migration was changed. Net migration for 2024 was revised down by 86,000 (or 20%) compared to the initial estimate in the May 2025 publication (Figure 8). For more information about ONS revisions to migration estimates, see Sumption (2024).
Figure 8
People who enter the UK without permission (e.g. in small boats) are included in the statistics if they claim asylum, but irregular migrants who do not claim asylum will not be included.
Acknowledgements
Thanks to Chris Stickney for comments on an earlier draft of this briefing. This research was supported by Trust for London. Trust for London is one of the largest independent charitable foundations in London and supports work which tackles poverty and inequality in the capital. More details at www.trustforlondon.org.uk.
Further reading
- ONS. 2025. International migration research, progress update: February 2025. Newport: ONS. Available online.
- ONS. 2025. Long-term international migration, provisional: year ending June 2025. Newport: ONS. Available online.
- ONS. 2025. Methods to produce provisional long-term international migration estimates. Newport: ONS. Available online.
- ONS. 2025. Reason for international migration, international students update: May 2025. Newport: ONS. Available online.
-
Media Coverage
-
The Guardian (25 May 2016)
Would local government be better off outside the EU? A head to head
-
The Guardian (25 May 2016)