
This briefing provides an overview of the EU ethnic minority population in the UK at the time of the last Census in 2021-22. It identifies the largest ethnic minority groups, discussing overall numbers and their origins in terms of both ethnicity and region of birth. It then analyses several key characteristics of this population, looking at the places they live in the UK, their employment outcomes, qualifications, and levels of proficiency in English.
-
Key Points
- Around 800,000 EU nationals living in the UK at the time of the Census were part of an ethnic minority group, making up 15% of the total
More… - With 274,000 living in the UK at the time of the Census, Asians – mostly from South Asia – were the largest ethnic minority group among EU nationals
More… - In terms of specific nationalities, Asian-Portuguese and Asian-Italian people were the largest EU ethnic minority groups, followed by Black Dutch
More… - Around 51% of ethnic minority EU nationals living in the UK at the time of the Census had been born in non-European countries
More… - EU ethnic minorities living in the UK at the time of the Census were particularly concentrated in London, as well as the Midlands and the North West
More… - EU ethnic minorities were less likely to be in employment and more likely to be unemployed than other EU citizens in the UK
More… - EU passport holders belonging to an ethnic minority group were less likely to have a university degree
More… - EU nationals in the UK identifying as Asian were more likely to report having poor levels of English proficiency than other groups
More…
- Around 800,000 EU nationals living in the UK at the time of the Census were part of an ethnic minority group, making up 15% of the total
-
Understanding the Evidence
This briefing uses data from the last round of the Census in the UK. Three separate censuses were conducted in the UK – England and Wales (2021), Northern Ireland (2021), and Scotland (2022). Where available, data from all three sources are combined to provide overall data for the UK in 2021/22. ... Click to read more.The briefing focuses on five main ethnic groups – Asian, Black, Mixed, Arab, and Roma. One of the sections provides a further disaggregation of these into specific ethnic subgroups (such as Asian Indian or Black Caribbean). An ‘other’ miscellaneous category contains all individuals who did not identify as either white or as part of these five main minority groups. The fact that a relatively large share of Spanish passport holders fell into this category suggests that it may contain significant numbers of Latinos. Data confidentiality restrictions meant that for some analyses – including those on employment outcomes and region of birth – it was impossible to separate Arab and Roma respondents (which were included in the ‘other’ and ‘white’ categories, respectively). The Scottish Census had more stringent confidentiality restrictions, meaning data for Scotland was excluded from some analyses.
While the 2021/22 Census included a separate ‘Roma’ ethnic category for the first time, many questions remain open about the quality of data surrounding this group. It is likely that the Census underestimates the true size of the Roma population, either because they were not included in the process, or because of a reluctance to disclose their ethnicity if counted. In addition, the Census also identified an unexpectedly high share of Romas born in Italy, which may at least partly reflect errors when completing the survey. Authorities behind the Scottish Census believed a number of people born in Rome, Italy, may have inadvertently ticked the ‘Roma’ ethnic group box, though it is impossible to know what share of Italian Romas identified by the Census fall into this group.
Nationality data are derived from a question about which passports each respondent held. The analysis includes those who held only an EU passport, as well as dual nationals holding both a UK and an EU passport (except for small numbers of non-Irish dual passport holders in Northern Ireland, where disaggregated data were not available). It remains possible that a very small number of triple passport holders (UK, non-EU, and EU) remain outside the scope of this analysis. While all EU passport holders are included in the overall analysis, data restrictions meant that at this stage it was only possible to separately analyse the top 9 EU nationalities of origin.
Around 800,000 EU nationals living in the UK at the time of the Census were part of an ethnic minority group, making up 15% of the total
At the time of the Census – conducted in 2021 in England, Wales, and Northern Ireland, and 2022 in Scotland – there were 5.34 million EU passport holders living in the UK. That included 634,000 dual nationals who also held a British passport, of which approximately half were UK-Irish citizens.
Around 15% of all EU nationals in the UK – 799,000 individuals – identified themselves as part of an ethnic minority group. The share of ethnic minorities varied widely by nationality. The highest shares of ethnic minorities were found among Dutch (60%), Portuguese (50%), Belgian (47%), Italian (44%), and Austrian (42%) passport holders.
In contrast, the lowest shares – of around 2% – were found among nationals of Latvia, Lithuania, and Poland. Citizens of newer member states in Central and Eastern Europe are generally less likely to be part of an ethnic minority group. However, there are sizeable Roma communities among Slovakian, Czech, and Romanian passport holders (which may also be undercounted, see Understanding the Evidence).
Figure 1
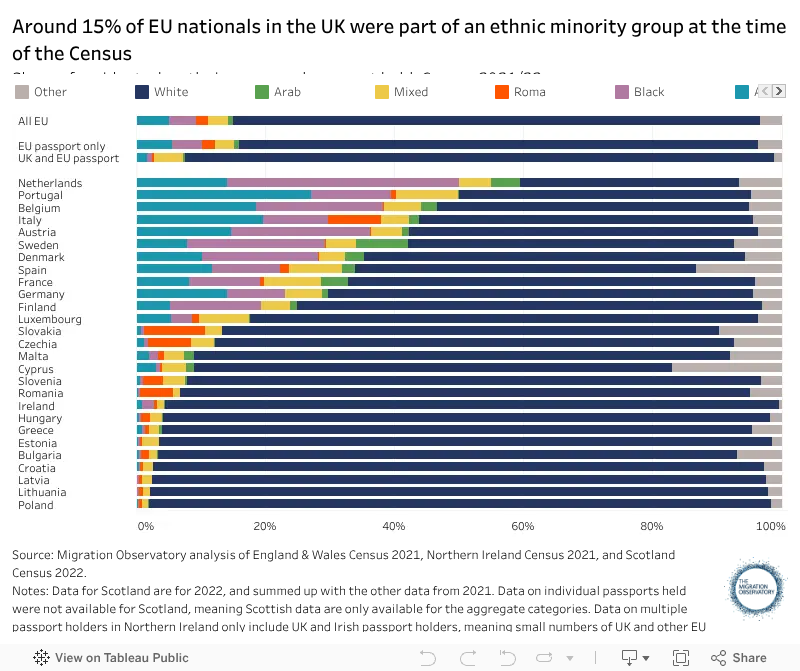
Dual nationals – people holding a UK as well as an EU passport – were considerably less likely to be part of an ethnic minority group than non-naturalised European citizens. Around 8% identified themselves as such at the time of the Census. The low share of ethnic minorities among dual nationals is partly explained by the high number of Irish dual citizens in this group, who are much less likely to be ethnic minorities than other nationalities.
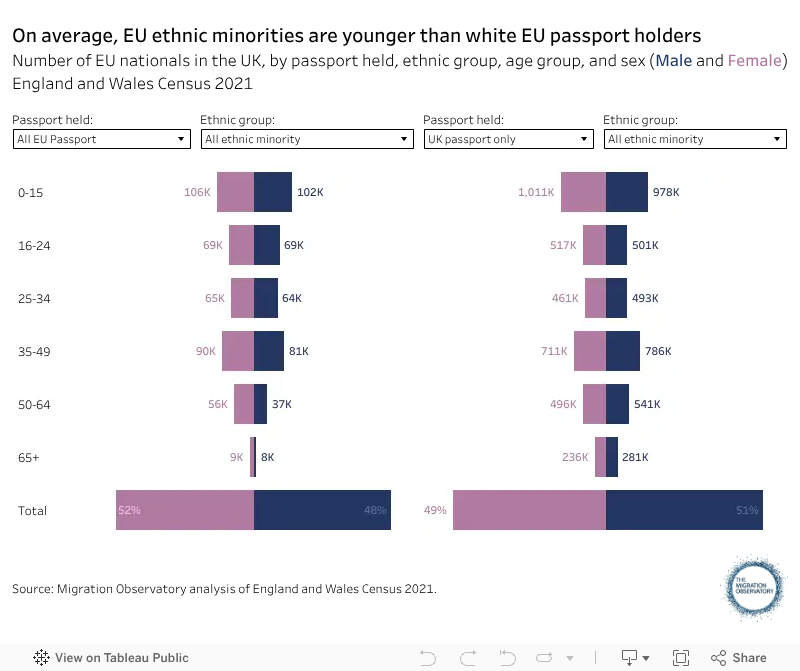
Figure 2 below shows the age and gender distribution of different nationality and ethnic groups, focusing on data from the England and Wales Census. The data reveal that the EU ethnic minority population is notably younger than that of white EU nationals. Most white EU nationals in England and Wales were of working age, between 25 and 49 years old – 55% of the total, compared to 40% among ethnic minorities. In contrast, the largest age group among EU ethnic minorities were children aged below 15, at 28% of the total, compared to just 14% among white EU nationals. Ethnic minorities were also slightly more likely to be female than white EU nationals (52% vs. 48%). These patterns hold among most EU ethnic groups and individual nationalities, though not among ethnic minority groups who held a non-EU passport (to compare different groups, see Figure 2).
Figure 2
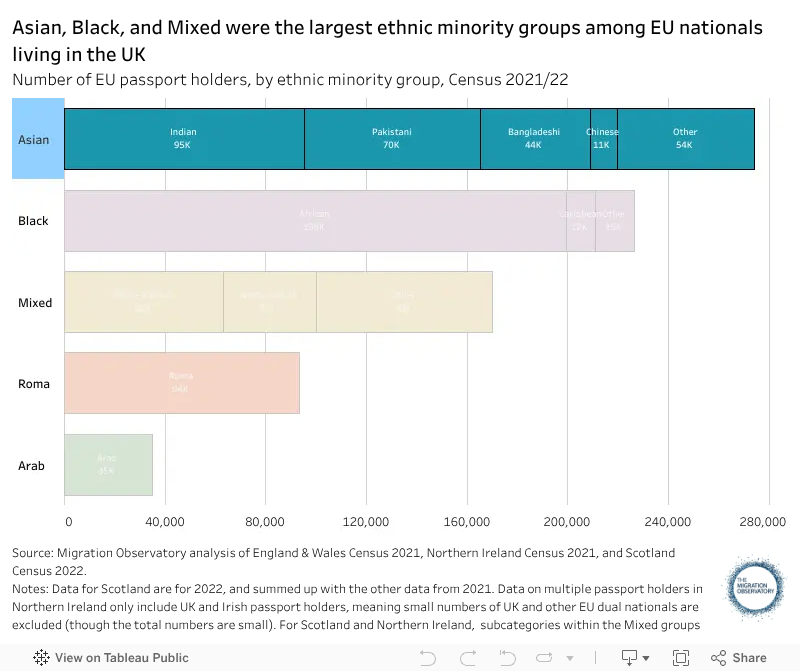
With 274,000 living in the UK at the time of the Census, Asians – mostly from South Asia – were the largest ethnic minority group among EU nationals
Among EU nationals living in the UK, the largest ethnic minority were people with Asian origins. At the time of the Census, around 274,000 EU passport holders identified as Asian. They made up 5% of the overall EU population, and 34% of all EU ethnic minorities. Most were ethnically South Asian, with origins in India (95,000), Pakistan (70,000), or Bangladesh (44,000). There was also a small Chinese minority, around 11,000 people, among EU passport holders in the UK.
The second largest ethnic minority group among EU nationals in the UK were people identifying as Black – 226,000 of them were recorded in the Census (4% of the total population, and 28% of all ethnic minorities). Most Black EU passport holders were of African origin, with a much smaller Black Caribbean minority.
Another large group were EU Passport holders of mixed ethnic origin, 170,000 of whom were living in the UK at the time of the Census (3% of all EU nationals, and 21% of ethnic minority passport holders). A little over a third of them – around 63,000 people – were of mixed White and Black origin, while another 37,000 were White and Asian.
Two smaller EU ethnic minority groups also had significant numbers of people living in the UK at the time of the Census – Romas (94,000) and Arabs (35,000). However, there are significant questions regarding data quality on the Roma population in the UK, meaning their true number could be larger (see Understanding the Evidence).
Figure 3
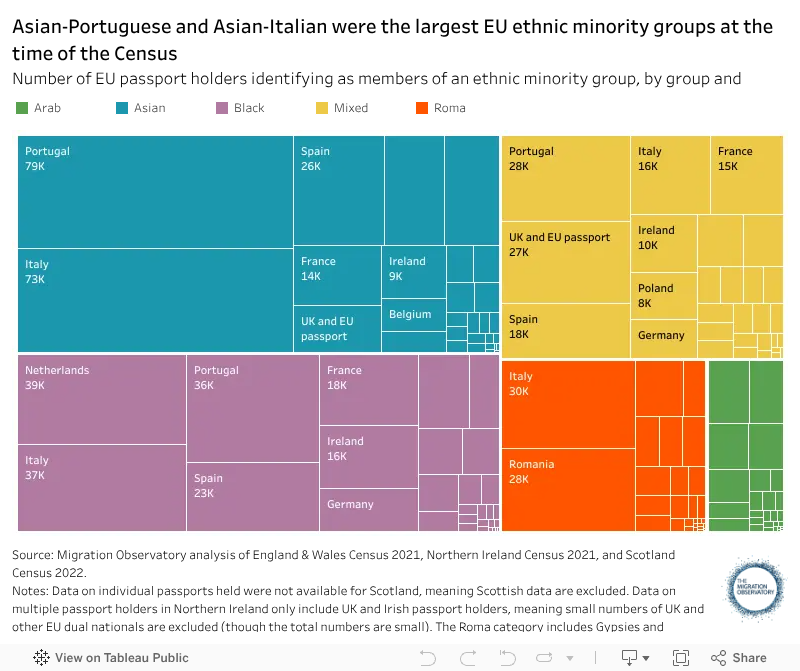
In terms of specific nationalities, Asian-Portuguese and Asian-Italian people were the largest EU ethnic minority groups, followed by Black Dutch
In Figure 4, we break down the main EU ethnic minority groups by nationality (data exclude Scotland, where disaggregated nationality data were not available). The largest such groups were people of Asian-Portuguese (78,000) and Asian-Italian (73,000) origin. There were also large numbers of Black Dutch (39,000), Black Italians (37,000) and Black Portuguese (34,000).
The data also show that Romanian Romas were one of the largest EU ethnic minority groups in the UK at the time of the Census, with around 28,000 individuals. However, the Census shows that more EU nationals identifying as Roma held an Italian passport, around 30,000. It is unclear to what extent this reflects an error in the data, as people were completing the Census (see Understanding the Evidence).
Figure 4
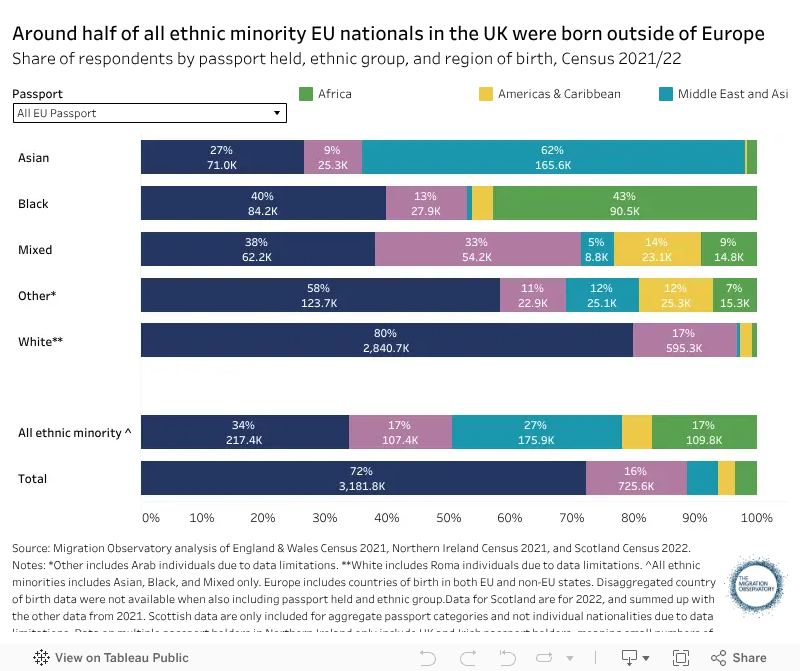
Around 51% of ethnic minority EU nationals living in the UK at the time of the Census had been born in non-European countries
Ethnic minority EU nationals were much more likely to be born outside of Europe than the overall EU population in the UK. A little over half of ethnic minority EU nationals – 317,000 people, or 51% – were born in non-European countries, mostly in the Middle East and Asia (27%) and Africa (17%). In comparison, the share for the overall EU population was 12%, and only 3% of white EU nationals had been born outside of Europe. These figures exclude smaller ethnic minority Roma and Arab groups, for which detailed country of birth data were not available.
There are important variations between different nationalities and ethnic minority groups (to explore the data, see Figure 5). Asian EU passport holders were most likely to be born in non-European countries, 62% having been born in Asia and the Middle East. In contrast, Black EU nationals were more evenly divided with regard to region of birth, with roughly equal numbers born in Europe and Africa, and a smaller minority born in the UK. People with mixed ethnic origins who held an EU passport were more likely to be born in the UK than all other groups – a third fell into this category.
The largest ethnic minority group by nationality, Portuguese citizens of Asian descent, was also the group most likely to have been born in non-European countries. Around 89% of them were born in countries outside of Europe and the UK. The share for the second largest group, Asian-Portuguese people, was much lower, at around 52%.
Other differences reflect the particular historical ties and citizenship rules of individual member states. For example, around 18% of Spanish passport holders in the UK were born in Latin America and the Caribbean, a share equal among ethnic minorities and the rest of the population. Irish nationals in the UK, on the other hand, were overwhelmingly born in the country – 93% of the total, and 62% of ethnic minorities.
Figure 5
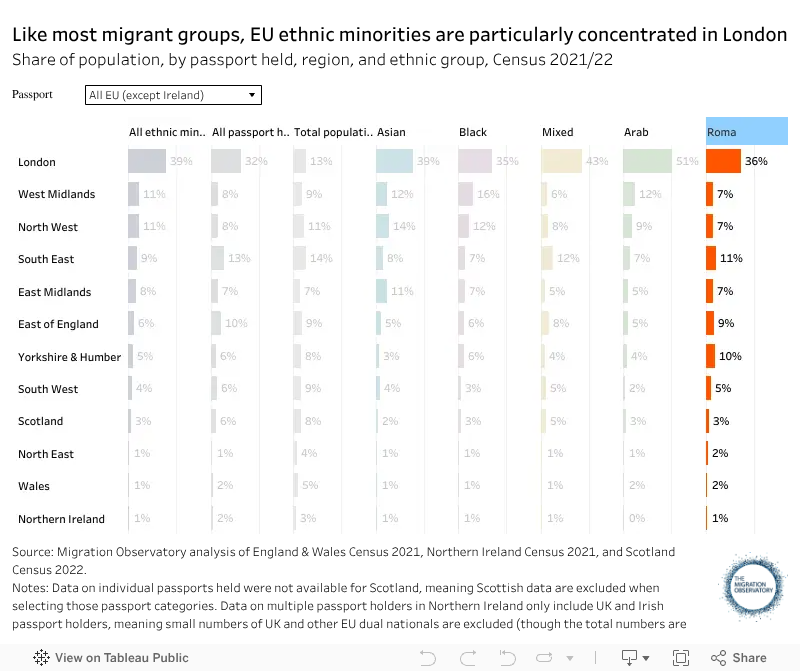
EU ethnic minorities living in the UK at the time of the Census were particularly concentrated in London, as well as the Midlands and the North West
Migrants in the UK tend to be concentrated in London. This applies to EU nationals living in the UK at the time of the Census – excluding Irish passport holders, many of whom are in Northern Ireland – 32% lived in London, as well as EU ethnic minority groups. Overall, 39% of EU ethnic minorities were in London, meaning they were slightly more likely to live in the capital than other EU nationals. In contrast, only 13% of the UK’s total population lived in London. This pattern was visible across different ethnic groups, although Arab EU passport holders and those with mixed ethnic origins were even more likely to be based in London.
Ethnic minorities were less likely to be based in the South East of England than other EU nationals, with the exception of Romas and those with mixed ethnic origins. Conversely, they were more likely to live in the West Midlands and the North West – a pattern driven by Asian and Black EU nationals. EU ethnic minorities, particularly Asian, were also overrepresented in the East Midlands. Relatively few EU nationals – and even fewer ethnic minority ones – were based in Wales, Scotland, and Northern Ireland, as well as the North East of England.
There is more variation among ethnic minority groups that hold specific EU passports (to explore the data, see Figure 6). Portuguese nationals with Asian origins were uniquely concentrated in the East Midlands. Almost a quarter of this group, the largest EU ethnic minority group in the UK, was based in the region. Asian-Italians, on the other hand, were overrepresented in the West Midlands and the North West. Another large group, Black Italians, were more widely distributed across England. Comparatively few were based in London, and significant numbers could be found in Yorkshire and the East of England, as well as the top regions mentioned above.
Figure 6
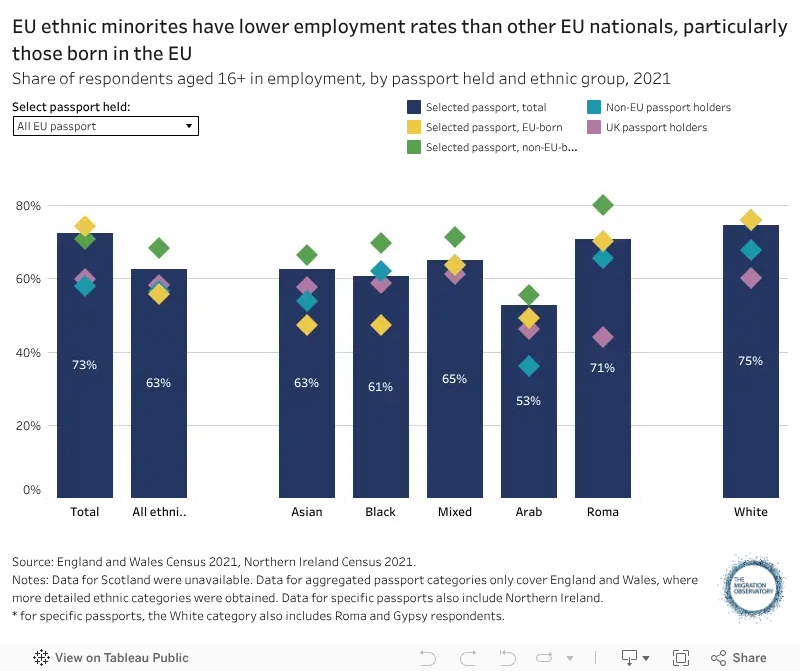
EU ethnic minorities were less likely to be in employment and more likely to be unemployed than other EU citizens in the UK
Among EU citizens in the UK, ethnic minorities have slightly worse labour market outcomes than the rest of the population in terms of the likelihood of being employed or unemployed.
In England and Wales – where more detailed data were available – around 63% of EU ethnic minorities aged 16+ were in employment in 2021, compared to 75% of white EU nationals. EU nationals were more likely to be employed than UK passport holders, though this advantage was much smaller among ethnic minorities – the respective figures for UK nationals were 58% and 60%. In contrast, non-EU passport holders had the lowest employment rates across ethnic groups.
Overall differences between ethnic groups were relatively small, although Arab EU passport holders had significantly lower employment than other groups, at 53%. Employment rates were highest among Roma EU nationals, although data reliability for this group may be relatively limited.
Interestingly, when looking at EU ethnic minorities, people born in the EU have significantly lower employment rates than those born in non-EU countries (56% vs. 68%). This difference is particularly visible among Asian and Black EU nationals, and completely absent among white EU passport holders.
Some other differences emerge when looking at specific nationality groups (see Figure 7 below to explore the data). For instance, employment rates were notably higher among the Asian-Portuguese population (71%) than among the Asian-Italian population (57%). In general, EU nationals from newer member states like Romania, Poland, and Lithuania – who were mostly white – had higher employment rates than other groups.
Figure 7
Similar patterns emerge when looking at unemployment rates. Overall, unemployment among EU ethnic minorities was double that of white EU nationals (8% vs. 4%). The respective figures for UK passport holders were 6% and 3% – showing that EU nationals were more likely to be unemployed than British nationals across ethnic groups.
Among EU ethnic minorities, unemployment was highest among Black respondents, and lowest among Asian ones. The same was true among ethnic minorities with a UK or a non-EU passport.
As above, outcomes for EU ethnic minorities born in a member state were notably worse than those for EU ethnic minorities born in a third country – unemployment rates were 9% and 7%, respectively, with particularly large differences among Black EU passport holders. Among white EU nationals, however, those born within the bloc had slightly lower unemployment than those born in a non-EU state.
Figure 8

It remains unclear why employment outcomes among EU ethnic minorities born in a member state were worse than those of EU ethnic minorities born in non-EU countries. As discussed in further sections, the former group have slightly better educational qualifications and English skills – both factors which are associated with better rather than worse labour market outcomes. Different explanations may be related to patterns of selection into migration – EU passport holders born in third countries are likely to have migrated twice, which might make them different from people who only migrate once, or, alternatively, different experiences while living in the EU or the UK itself. However, current data does not allow us to further examine this.
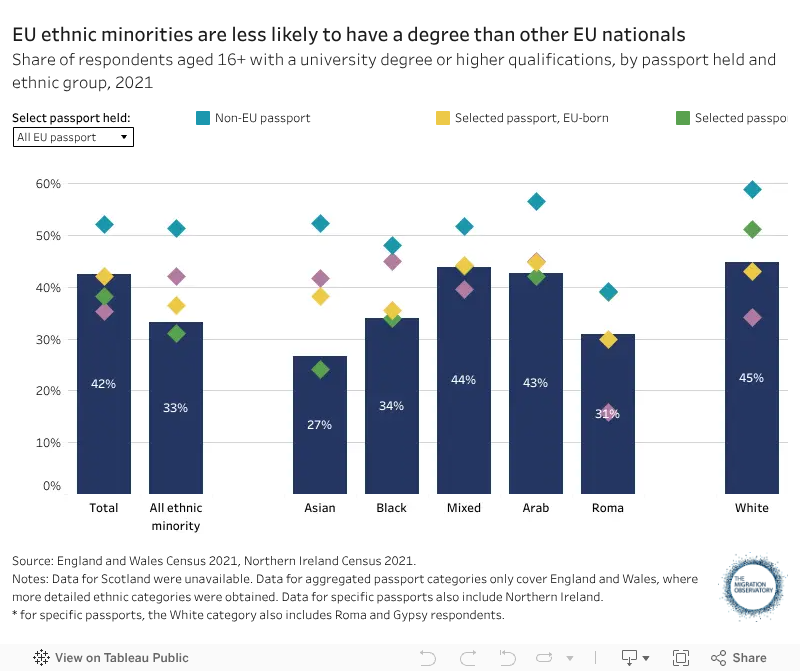
EU passport holders belonging to an ethnic minority group were less likely to have a university degree
In 2021, around 33% of ethnic minority EU nationals aged 16 or more in England and Wales had a university degree (or an equivalent qualification). Among white EU passport holders, the share was considerably higher, at 45%. The opposite pattern was evident among UK passport holders, where ethnic minorities were more likely to have a degree than white respondents (42% vs. 34%).
Across ethnic groups, non-EU passport holders were most likely to have a degree – likely because they have long been subject to immigration rules that partly select people based on skills and qualifications.
The share of the population who had a degree varied considerably between different EU ethnic minority groups – Asian EU nationals were least likely to have a degree (27%), followed by Black EU nationals (34%), and then those with mixed ethnic origins (44%). This pattern was consistent across different nationality groups (see Figure 9 to explore the data).
Comparing ethnic minorities with an EU passport, those born in the EU were slightly more likely to have a degree than those born outside the bloc (36% vs. 31%). This difference was almost entirely driven by Asian respondents, with no large differences based on the country of birth among other groups.
Figure 9
Asian EU nationals in the UK were more likely to report having poor levels of English proficiency than other groups
On average, EU ethnic minority groups in England and Wales in 2021 were slightly more likely to report having poor levels of proficiency in English than white EU passport holders (12% vs. 8%). This difference was mostly driven by EU citizens who identified as Asian – 16% of them reported poor or minimal levels of English, compared to 13% of Arab EU citizens, and 8% of those who identified as Black or Mixed ethnicity. A higher share of Roma EU nationals also reported poor levels of English at 17%, though the usual data caveats apply for this group.
Across ethnic groups, EU passport holders born in third countries were more likely to report poor levels of English than those born in the EU. In addition, some of the largest EU ethnic minority groups by nationality were more likely to report poor levels of English proficiency than the average, including Asian Italian (22%), Asian Portuguese (18%), and Black Portuguese (18%) nationals. Among Black Italian nationals, the share was just 6%.
There were only small differences between EU and non-EU ethnic minorities when it came to levels of proficiency in English. Most notably, non-EU passport holders who identified as Black were considerably less likely to have poor levels of proficiency in English than black EU nationals (3% vs. 8%).
Figure 10
