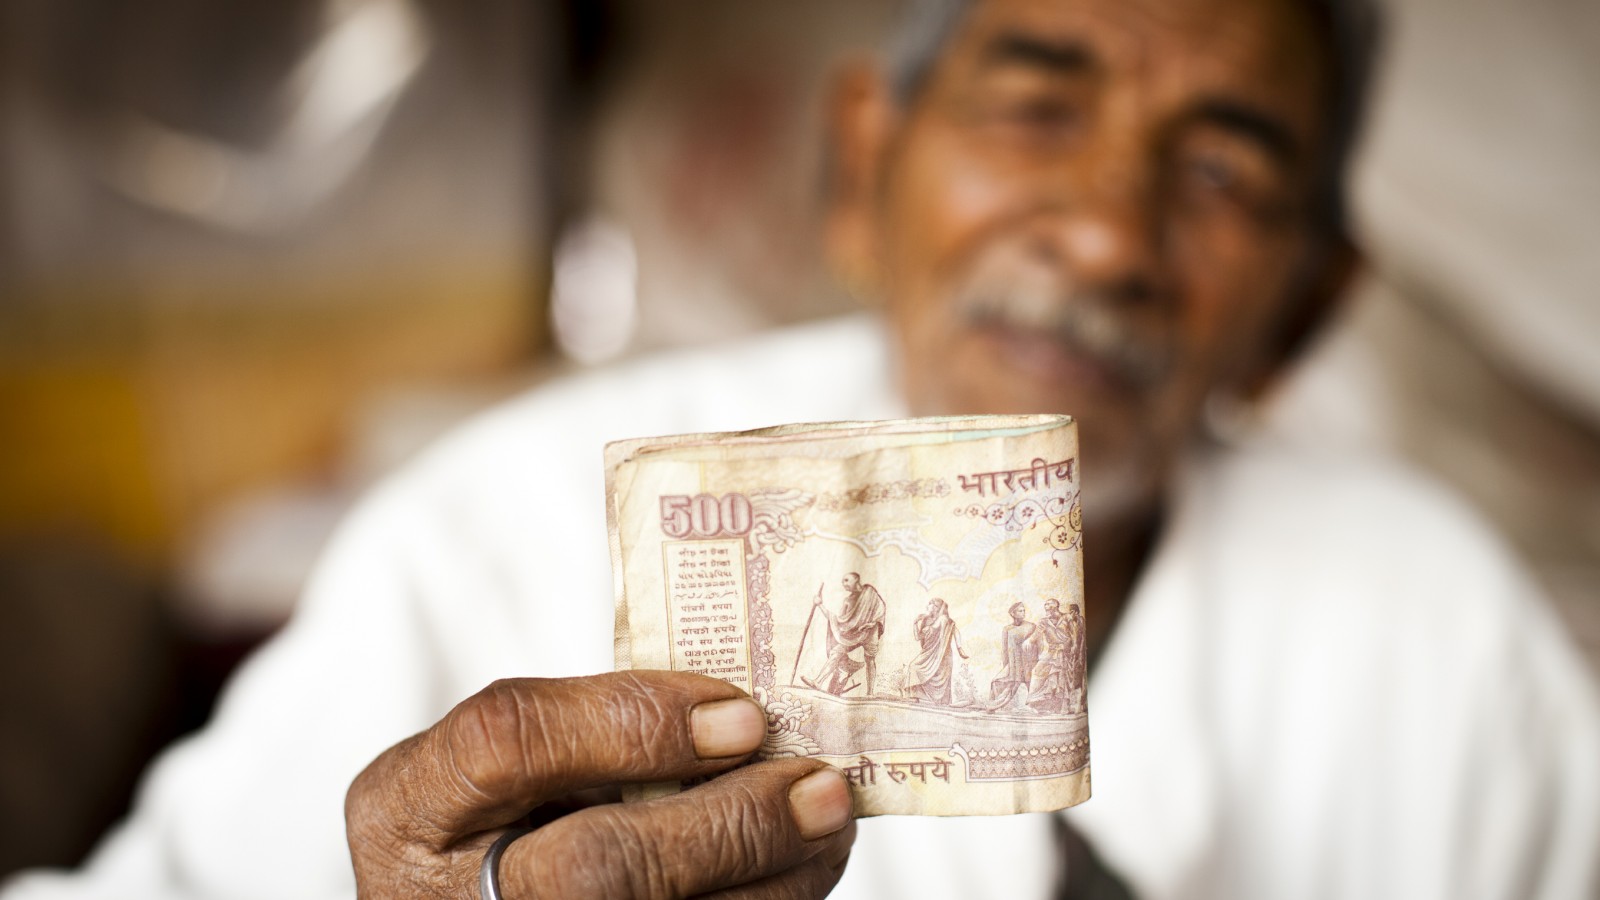
This briefing describes remittance flows both to and from the UK. Remittances are transfers of money from residents of one country to residents of another country and are often associated with migrants sending money to families and communities.
-
Key Points
- The UK sends twice as much money abroad as it receives, but remittances comprise a smaller share of
the GDP than in most other countries.
More… - Although there are multiple ways to measure how important remittances from the UK are for recipient countries, Kenya, Nigeria, Zimbabwe, and Lithuania are among the top 20 countries regardless of the measurement method chosen.
More… - UK remittance costs still exceed the G8 goal, but have been trending downward over the last decade.
More… - The cost of remittances varies substantially depending on the country where remittances are sent and the method of transfer.
More… - Surveys on remittances from the UK suggest that remittance behaviour varies substantially across migrant/ethnic groups.
More… - The impacts of the COVID 19 crisis on remittance flows are currently unclear, but projected to lead to a significant fall in international remittances.
More…
- The UK sends twice as much money abroad as it receives, but remittances comprise a smaller share of
-
Understanding the Evidence
Ever since the end of foreign exchange controls in the UK (i.e. 1979), there is no official mechanism for recording international monetary transactions including the volume, destination and use of remittances from the UK. The UK Office for National Statistics (ONS) does not publish estimates of remittances to and from the UK. Therefore, the discussion below focuses on unstandardised estimates from the World Bank, Eurostat and remittance-recipient countries. Even within the same organization (e.g. World Bank) there are different estimates of remittances flows to and from the UK. There are advantages and disadvantages to each of the estimates presented.
Remittances flows are also difficult to capture in totality. Unofficial transfers (e.g. money sent with friends and family members visiting the UK) may account for a significant portion of remittances making it difficult to record these flows.
The UK sends twice as much money abroad as it receives, but remittances comprise a smaller share of the GDP than in most other countries
There are several sources of information on remittances. Both the World Bank Annual Remittances Data and Eurostat base their estimates on the UK’s balance of payments, according to which remittance outflows from the UK stood roughly at GBP 7.7 billion in 2018. It is likely that this estimate is lower than the true amount of flows because it does not include unofficial transfers. It also fails to account for any social benefits, including social security and pensions, that nonresidents acquire while living in the UK or donations from UK residents to non-profits abroad in the context of international development. World Bank Bilateral Remittances Matrix suggests that outflows from the UK are close to GBP 23.6 billion.
Figure 1
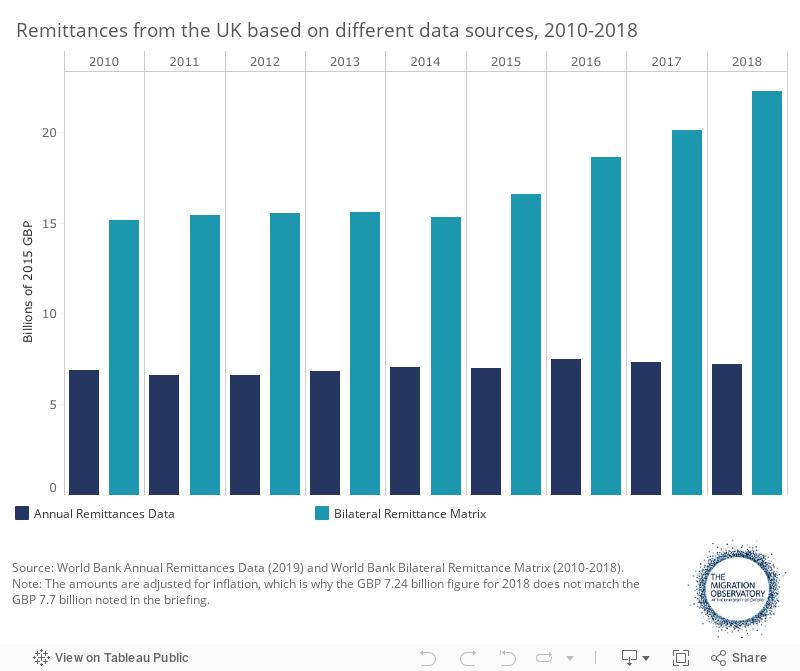
The different sources consistently point to the UK as one of the top-20 remittances sending countries in the world based on the total money sent. The World Bank Annual Remittances Data suggest that in 2018 the UK occupied the 15th position, down from 10th in 2014 after China, Qatar, South Korea and the Netherlands became more prominent remittance senders than the UK. Nevertheless, World Bank Bilateral Remittances Matrix has continuously placed the UK as the fourth largest remittance sender in the world. The latter source lists India and Nigeria as the main destinations of remittances from the UK.
UK remittances overall comprise a small share of its GDP. Based on the Annual Remittances Data, in 2018 outflows were equivalent to 0.4% of the UK’s GDP. By contrast, Kuwait—one of the largest remittance senders both in terms of the total money and share of GDP sent—remitted an amount equivalent to 10% of its GDP. In fact, in 2018 the UK was only 85th out of 117 countries for which data are available according to the share of GDP that remittances accounted for. This means that the UK remits less, as a share of its GDP, than most other countries in the world, so remittance outflows are likely to have a limited impact on its overall growth, especially in light of the positive impacts immigrants have on the UK’s economic development (Boubtane et al. 2016).
The UK not only sends, but also receives remittances. In 2018, the UK received roughly GBP 4.1 billion in remittances according to the Annual Remittances inflows data, equivalent to 0.2% of its GDP. The World Bank Bilateral Remittance Matrix puts the amount at roughly GBP 3.4 billion and points to Australia and the United States as the largest remittance senders to the UK. As was the case with remittances outflows, however, it is likely that remittances inflows are also underestimated in different datasets.
Although there are multiple ways to measure how important remittances from the UK are for recipient countries, Kenya, Nigeria, Zimbabwe, and Lithuania appear among the top 20 countries regardless of the measurement method chosen
There are a few ways to assess for which countries remittances from the UK are the most important. The simplest way is to look at the total money received from the UK. In 2018, India topped the list with GBP 3 billion (see Figure 2). Alternatively, one can compare remittances from the UK as a share of each country’s GDP. According to this metric, Jamaica’s economy was the most reliant on remittances from the UK as these inflows are equivalent to 1.7% of Jamaica’s GDP. Finally, it is also important what share of all remittances sent to a particular country come from the UK. It shows whether remittance sources are diversified and thus a country is exposed to limited risk if remittances from the UK dry up. Based on this measurement, Ireland came in first because roughly half (52%) of all remittances sent to Ireland in 2018 originated from the UK.
Figure 2
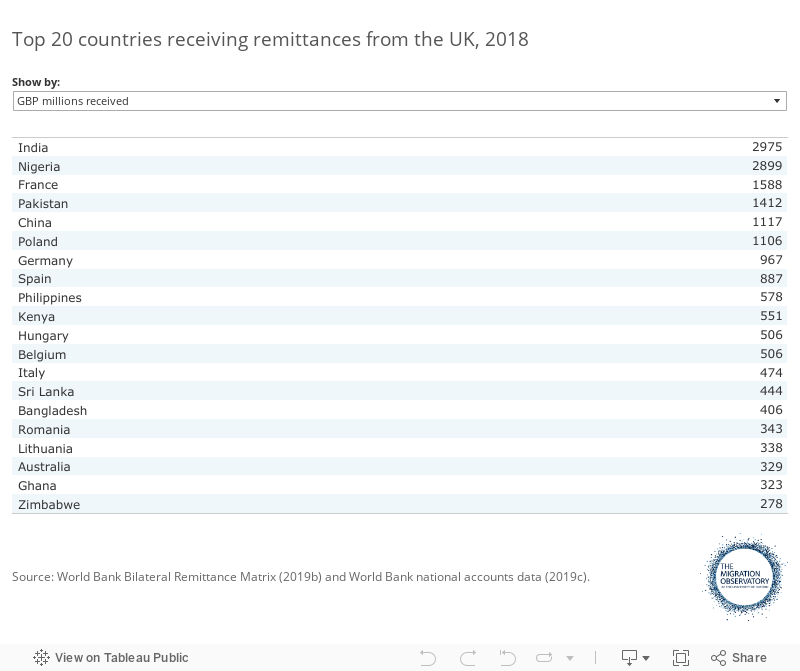
A few countries appear in the top 20 regardless of the measurement method chosen. These include Kenya, Nigeria, Zimbabwe, and Lithuania. Kenya, for example, in 2018 received roughly GBP 556 million, making it the 11th largest recipient of remittances from the UK. This amount was equivalent to roughly 0.8% of its GDP, which means it is the 9th economy in the world most reliant on British remittances. Roughly a quarter (27%) of all remittances sent to Kenya come from the UK, placing it 7th in the world according to the share of all remittances that come from the UK.
UK remittance costs still exceed the goal, but they have been trending downward over the last decade
Migrants in the UK send money home using several channels. These include family and friends returning home, money transfers operators (MTOs) such as Western Union and MoneyGram, banks, and informal hawala brokers (House of Commons 2004). The hawala method of transferring money is informal and it is very difficult to trace most of these flows using official government records.
Sending remittances via MTOs and banks is typically not free. In 2019, the average cost of sending £120 from the UK abroad was roughly £8.5 (World Bank 2019d). In 2009, the UK, together with other G8 countries, set out a target to reduce the global average cost of sending international remittances from 10% to 5% of the transaction amount within five years (OECD 2011). A decade later, the UK is half-way to achieving that goal: since 2009, the cost of sending remittances from the UK decreased by 2.5 percentage points, from 9.66% in 2009 to 7.12% in 2019. The current Sustainable Development Goal aims to reduce the cost of remittance transactions to 3% by 2030.
Figure 3
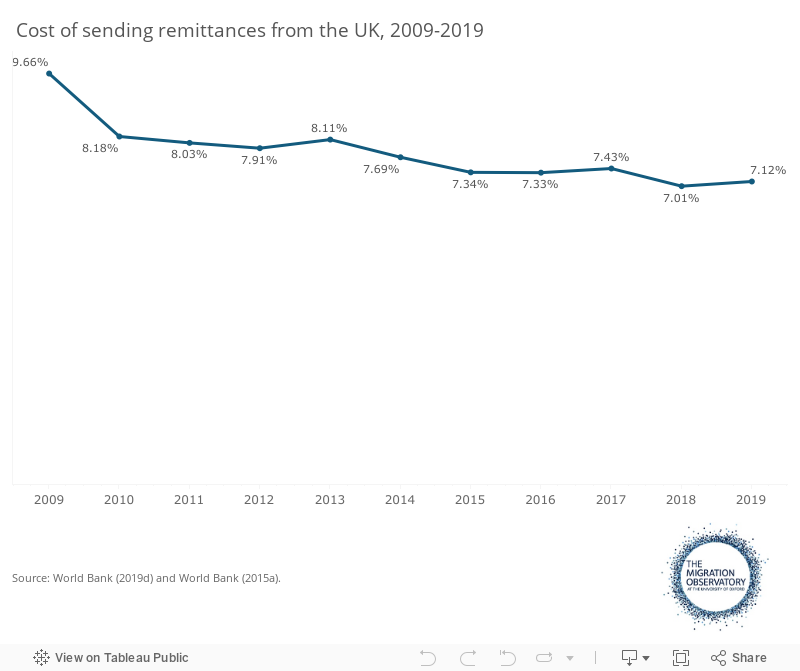
There are a few reasons why remittance costs remain high. First, in a global trend known as ‘de-risking’, banks over the last years closed the accounts of several MTOs in order to reduce risk and comply with anti-money laundering and other regulations imposed after 2008 (Datta and Vicol 2019; GPFI 2019; FCA 2016). As a result, it has become more difficult for MTOs to operate, leading to higher remittance costs. Second, cash transfers—which tend to be more expensive than digital transfers (see the following section)—continue to dominate the UK market, especially with regard to the developing countries (GPFI 2019; World Bank 2015a). This is particularly the case when money is sent to countries with least developed domestic money payment systems (FSDAfrica 2018).
The cost of remittances varies substantially depending on the country where remittances are sent and the method of transfer
Figure 4 illustrates the cost of sending £120 from the UK to select countries in the world at the end of 2019. Transfer costs vary greatly: for example, the cost of sending £120 from the UK to Bangladesh using an MTO that offers cash and debit/credit card payments cost -0.18%, which means the transfer was essentially free. According to the World Bank, the negative cost may be due to a promotion at the time the price was recorded. By contrast, sending the same amount of money to Lithuania in cash would have cost 24.88% or £29.86.
Figure 4
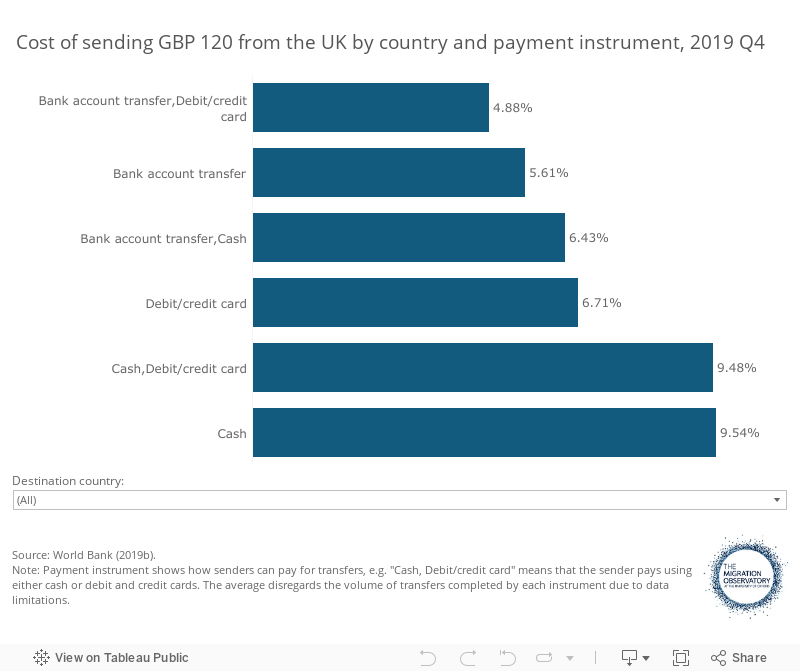
Cash payments tend to be more expensive than bank account transfers. Across all countries for which data are available, the average cost of remitting £120 in cash cost £11.44 or 9.54%. The equivalent cost of a bank transfer (using an operator that also offers debit/credit card transfers) was almost half the price: £5.86 or 4.88%.
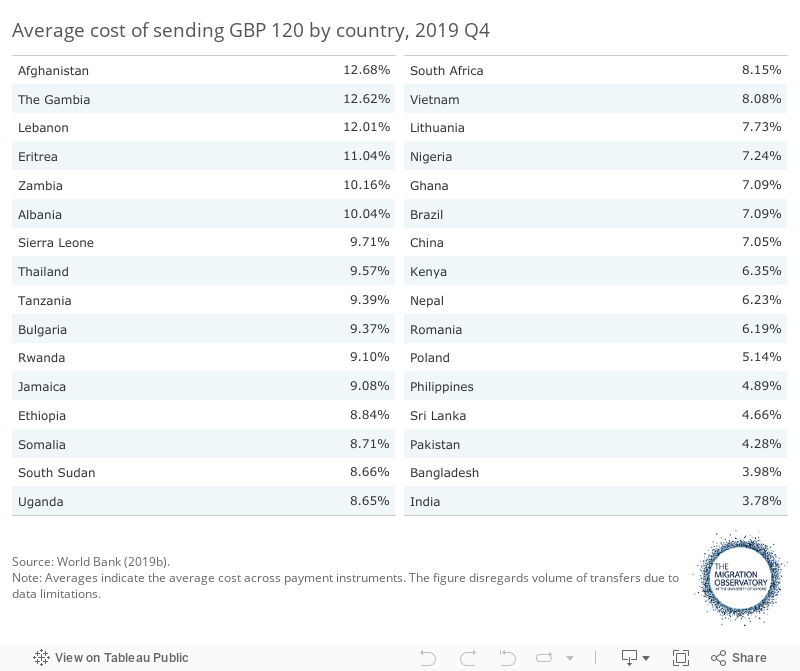
In general, sending remittances to countries in the Middle East and Africa is the most expensive whereas destinations in South Asia are the cheapest. European countries are dispersed in the middle. According to Figure 5, Afghanistan is the most expensive country to send money from the UK, mostly due to high fees associated with cash payments. India—where all transfer methods are below 6%—is the least costly destination.
Figure 5
It is important to note that there are other barriers to remitting other than cost. For example, these include the lack of necessary documentation for refugees living in the UK (Isaacs 2018), lack of physical and technological availability of providers and means, and technological illiteracy (Metzger et al. 2019).
Surveys on remittances from the UK suggest that remittance behaviour varies substantially across migrant/ethnic group
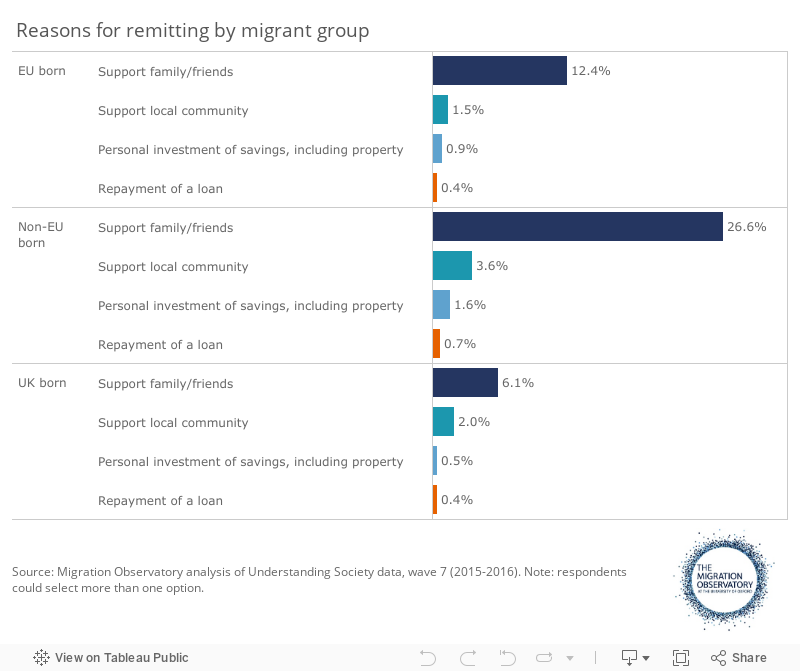
Based on the 2015-2016 Understanding Society survey, non-EU migrants living in the UK are twice as likely to remit as those born in the EU. For example, 30% of those born outside the EU said that they sent money abroad at least once over the last year compared to 14% of EU citizens. Unsurprisingly, British nationals are least likely to remit, with only 8% of them sending money abroad. People mostly remit money in order to support family and friends (see Figure 6).
Figure 6
Different migrant groups differ not only in terms of whether they remit, but also how much they send abroad. In 2015, the World Bank commissioned a survey of 602 Bangladeshi, Ghanaian and Romanian remitters in London (World Bank 2015b). Romanians sent the largest amounts of money back home among men in the survey (close to £3,500 per year in average). On the other hand, Bangladeshis sent the highest average amount of money back home among women (close to £2,500 per year).
Other surveys have included other migrant/ethnic groups and found other patterns regarding remittances from the UK. For instance, Clark and Drinkwater (2007), using the Fourth National Survey of Ethnic Minorities, found that those of Caribbean and Pakistani origin are more likely to remit (37% of those from the Caribbean and 30% of Pakistanis) than Chinese (27%), Bangladeshis (21%) and Indians (14%). DFID (2006) used a sample of almost 10,000 Black and minority ethnic households in the UK to explore their remitting patterns. Results suggested that Black Africans had the highest propensity to remit, accounting for 34% of remitters in the survey, while only representing 10.5% of the sample. Black Caribbeans represented 12% of those who remit, the same share as their representation in the sample (12.2%), while Indians accounted for 14% of remitters, a relatively low share given their sample representation (22.8%).
Even with these studies, there is very little information on the characteristics of remitters in the UK, including characteristics such as income levels and welfare programme participation. Moreover, the existing research focuses on certain ethnic groups at one period in time. As a result, there is a lack of information about the dynamics of remitting behaviour over time.
The impacts of the COVID 19 crisis on remittance flows are currently unclear, but projected to lead to a significant fall in international remittances
In April 2020 the World Bank predicted that the COVID 19 outbreak could lead to a 20% drop in remittance flows. At the time of publication of this briefing, it is not possible to know with any certainty whether this is correct. A substantial drop in global remittance flows may well occur in response to the crisis and its wide ranging economic impacts. However what actual level that decrease may end up being cannot be precisely estimated. All projections are based on a number of assumptions about the impact of the crisis on different economies around the world.
It is also unclear if previous trends in remitting will still apply in the post-COVID era as economies may change substantially. In the short-term, a key factor is the impact of the crisis on those sectors and industries which rely heavily on a migrant workforce. In the long-term, it is also important to factor in the impact of the crisis and travel restrictions on future migration flows. As such, remittances may be expected to decrease, but it is difficult to predict by how much.
Evidence gaps and limitations
In the UK Balance of Payments (i.e. Pink Book), there is a category call ‘other payments by households’, which includes workers’ remittances and transfers to UK non-profit institutions. However, it is not possible to disaggregate workers’ remittances from flows to non-profit institutions serving households (see Office for National Statistics [2010]).
Although not covered in this briefing, blockchain and cryptocurrencies have also received a lot of attention from scholars and MTOs over the last few years with claims that these technologies could substantially reduce the cost of remittances. However, there remain some uncertainties about the feasibility of this in practice.
Acknowledgements
Thanks to Marina Fernandez Reino for help with the Understanding Society data used in this briefing, and to Ghada Fayad and Anna Lindley for helpful comments and suggestions on an earlier version of this briefing.
References
- Boubtane, Ekrame, Jean-Christophe Dumont, Christophe Rault. ‘Immigration and economic growth in the OECD countries 1986–2006’. Oxford Economic Papers 68 (2), 340-360. 2016.
- Clark, K. and S. Drinkwater. ‘An Investigation of Household Remittance Behaviour: Evidence from the United Kingdom.’ The Manchester School 75, 717-741. 2007.
- Datta, Kavita and Dora-Olivia Vicol. ‘Derisking London’s Remittance Marketplace. Brief 2.’ London: Queen Mary, University Of London. 2019.
- DFID. ‘BME Remittance Survey.’ Research Report. London: Department for International Development. 2006.
- Eurostat. Personal remittances statistics. Luxembourg: Eurostat, 2020.
- FCA. FCA Research into the issue of de-risking. London: Financial Conduct Authority. 2016.
- FSDAfrica. ‘Moving money and mindsets: increasing digital remittances across Africa’. Nairobi: FSDAfrica. 2018.
- GPFI. ‘G20 National Remittance Plan 2019 United Kingdom’. Global Partnership for Financial Inclusion. 2019.
- House of Commons International Development Committee. ‘Migration and Development: How to make migration work for poverty reduction.’ London: House of Commons. 2004.
- Isaacs, Leon, Sarah Hugo, Gemma Robson, Charlie Bush, Poppy Issacs, and Iñigo Moré Martinez. ‘Impact of the Regulatory Environment on Refugees’ and Asylum Seekers’ Ability to Use Formal Remittance Channels.’ KNOMAD working paper 33. 2018.
- Metzger, Martina, Tim Riedler, and Jennifer Pédussel Wu. ‘Migrant remittances: Alternative money transfer channels PDF Logo.’ Working Paper 127/2019. Berlin: Berlin Institute for International Political Economy (IPE), Hochschule für Wirtschaft und Recht Berlin. 2019.
- OECD. Tackling the Policy Challenges of Migration: Regulation, Integration, Development. Development Centre Studies. 2011.
- Office for National Statistics. The Pink Book. 2010 ed. London: Office for National Statistics. 2010.
- University of Essex, Institute for Social and Economic Research, NatCen Social Research, Kantar Public. Understanding Society: Wave 7. 2015-2016.
- World Bank. ‘Remittance Prices Worldwide.’ Issue 14. Washington, D.C.: World Bank. 2015a.
- World Bank. Migrants’ Remittances from the United Kingdom. Washington, D.C.: The World Bank. 2015b.
- World Bank. Bank Annual Remittances Data 2018. Washington DC: The World Bank, 2019a.
- World Bank. Bilateral Migration and Remittances 2010-2018. Washington DC: The World Bank, 2019b.
- World Bank. GDP (current US$). Washington, D.C.: World Bank national accounts data and OECD National Accounts data files. 2019c.
- World Bank. ‘Remittance Prices Worldwide.’ Issue 32. Washington, D.C.: World Bank. 2019d.
- World Bank. Press Release No: 2020/175/SPJ “World Bank Predicts Sharpest Decline of Remittances in Recent History” Washington, April 22, 2020.