
This briefing summarises key statistics from the 2011 Census for the East of England, and its constituent districts and unitary authorities. The briefing provides information about population levels; the number, population share, age and gender of foreign-born residents; as well as countries of origin, main languages and passports held. Finally, the briefing compares the East of England to other regions of England and Wales and the 2001 and 2011 Census results.
-
Key Points
- In 2011, the total usual resident population of the East of England stood at 5,842,965. About 11% of those residents (642,215) were born outside of the UK. This represents an increase of 70% in the foreign-born population of the region since 2001.
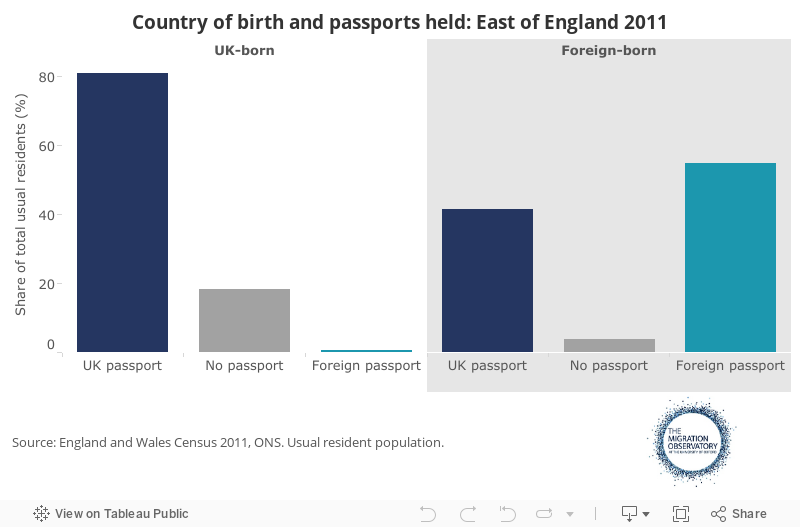
More… - In 2011, 41.6% of the non-UK born population held a UK passport, and 54.7% held only a non-UK passport. The rest (3.7%) held no passport.
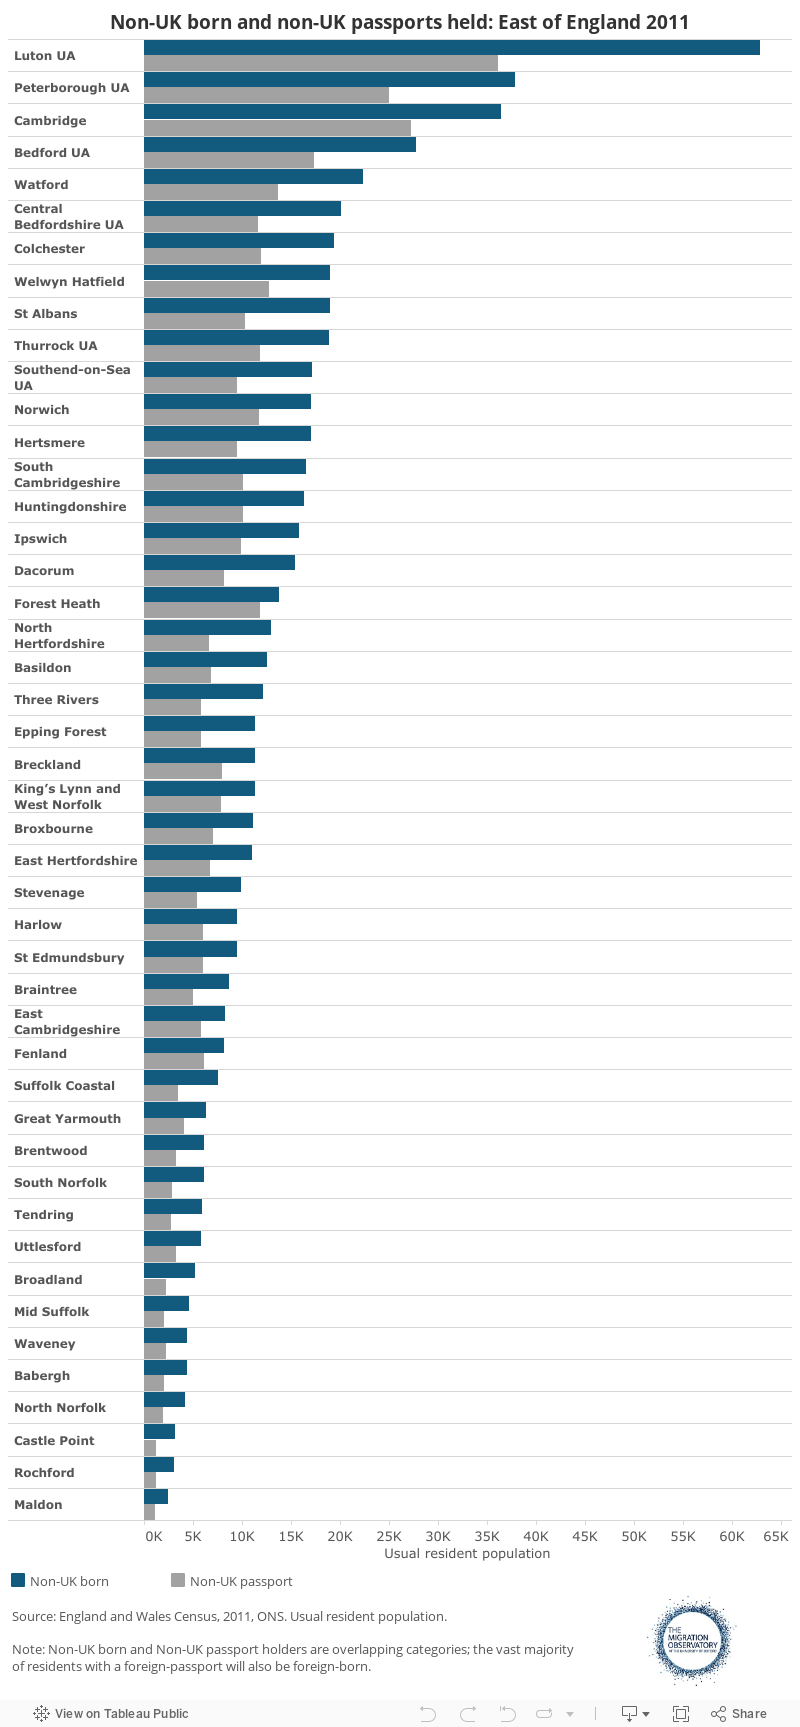
More… - The Luton unitary authority had the highest number (62,872) as well as the highest population share (31%) of non-UK born residents in the region.
More… - Between 2001 and 2011, the total non-UK born population grew the most in Luton (26,610 additional non-UK born residents), but the biggest percentage increase in the non-UK born population occurred in Fenland (a 211% increase).
More… - Residents born in Poland represent the most numerous non-UK born group in the East of England (62,100 residents) followed by residents born in India, Ireland, United States and Pakistan.
More… - In 2011, the East of England occupied the 3rd position in terms of the population numbers and the 4th position in terms of the population share of non-UK born residents, out of the ten regions of England and Wales.
More…
- In 2011, the total usual resident population of the East of England stood at 5,842,965. About 11% of those residents (642,215) were born outside of the UK. This represents an increase of 70% in the foreign-born population of the region since 2001.
-
Understanding the Evidence
The census is the most complete source of information about the population. It is particularly useful for obtaining population estimates for small geographical areas and information on the characteristics of such a population. Other sources of information on population characteristics in the UK such as the Labour Force Survey have large margins of error at the local level, because they are based on survey data and rely on a limited number of observations at the local level. The census is based on a count of people and households, with efforts to include everyone, but it is supplemented by a survey to detect and estimate those who are missed at first.
The latest UK censuses were conducted during 2011, with 27 March 2011 as the official census day of record. In England and Wales the census was conducted by the Office for National Statistics (ONS), the National Records of Scotland in Scotland, and the Northern Ireland Statistics and Research Agency in Northern Ireland. There are different release dates for the data in these censuses (including the migration-related data). Therefore, when comparing the East of England to other parts of the UK, the current briefing uses only information from the ONS 2011 Census releases for England and Wales.
When analysing the nature of migration, defining who counts as a migrant is of crucial importance. Yet there is no consensus on a single definition of a ‘migrant’. Different datasets—and analyses from these datasets—use a variety of definitions of ‘migrant,’ including (1) country of birth, (2) nationality, (3) passports held, (4) length of stay, (5) reason for migration and (6) being subject to immigration controls. For example, people who are foreign-born are not all foreign nationals; likewise, some foreign nationals may have lived in the UK for decades while others reside in the UK for only a year. Perhaps most importantly, not all foreign-born UK residents are subject to immigration control. Some are the children born abroad of UK national parent(s)–e.g. service personnel. Others are long-term residents who have acquired British citizenship. EEA nationals are also not subject to immigration control, yet are often considered migrants in public debate and in ONS net migration counts. This includes EEA nationals born outside the EEA.
The data analysed in this briefing are based mainly on the census statistics for country of birth as well as passports held, not current nationality. The census collected data on passports held, and this can be used as a proxy for nationality; yet nearly 17% of the total usual resident population of England and Wales held no passport in 2011 (ONS, 2013) and data for passports held in not available for 2001, precluding the measure of change over time. When using data on country of birth, it is important to note that many of those included in the foreign-born category will have British citizenship.
The data presented include statistics for usual residents only, unless otherwise specified. Usual residents are defined as anyone in the UK on census day who had stayed or intended to stay in the UK for 12 months or more (or were outside the UK but had a permanent UK address and intended to stay outside the UK for less than 12 months). In terms of countries of birth, data are available for 160 countries as part of regional totals. At the local level, however, data have not been provided for all countries of origin. Instead, the ONS has identified 27 key countries of origin most common at the national level, and all local analyses of the most frequent countries of origin only refer to the most frequent countries out of the 27 key countries of origin. As such, particularly at the local level, there may be other more numerous foreign-born groups that the current census release does not include. However, the totals for each region of origin are available for local areas.
See the Migration Observatory video interview of Peter Stokes, 2011 Census Statistical Design Manager, for further discussion.
In 2011, the total usual resident population of the East of England stood at 5,842,965. About 11% of those residents (642,215) were born outside of the UK. This represents an increase of 70% in the foreign-born population of the region since 2001
As shown in Table 1, in 2011, the total usual resident population of the East of England stood at over just over 5.8 million people, 642,215 of which had been born outside of the UK. This represents 11% of the total resident population of the region (a 57% increase from 7% in 2001). In 2011, the foreign-born population of the East of England accounted for 8.6% of the total non-UK born population of England and Wales (an increase of 5% from 8.1% in 2001).
Since 2001, the foreign-born population grew by 264,195 persons, accounting for 57.6% of the total population growth of 458,825 usual residents in the decade. While overall the population of the East of England increased by nearly 9% between 2001 and 2011, the non-UK born resident population grew by 70% in the same period.
Table 1 – Key census statistics for the East of England
| 2001 | 2011 | Change (%) | |
|---|---|---|---|
| Total usual resident population | 5388140 | 5846965 | 8.5% |
| UK-born resident population | 5010120 | 5202750 | 3.9% |
| Non-UK born resident population | 378020 | 642215 | 69.9% |
| Non-UK born as share of the region's population | 7% | 11% | 56.6% |
| Share of non-UK born population of England and Wales | 8.1% | 8.6% | 5.1% |
| Non-UK passport holders | 388664 | ||
| Non-UK passport holders as share of the region's population | 6.7% |
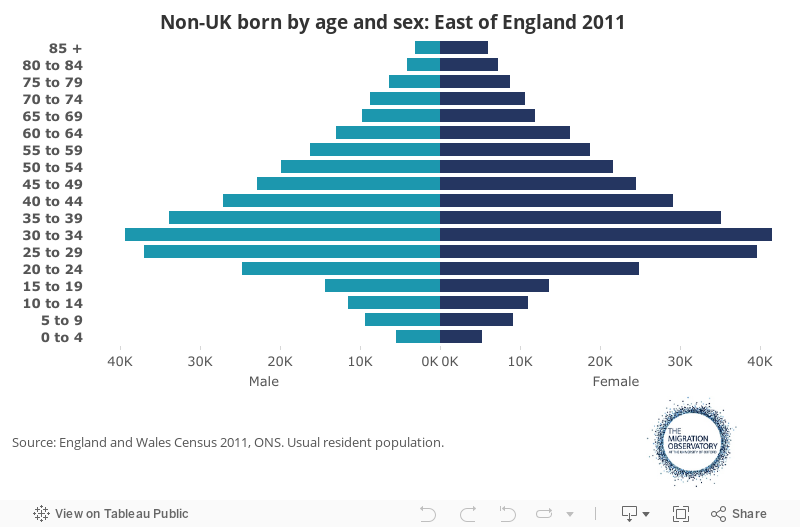
In 2011, 43% of the region’s foreign-born residents were aged 20-39 years of age and 71% were aged 20-59 years of age (see Figure 1). In comparison, 23% of the UK-born population were between 20 and 39 years old in 2011, and 50% we aged between 20 to 59 years old. The most common age-groups for the non-UK born population of the East of England were the 25-29 and 30-34 age groups, accounting for 12% and 13% of the non-UK born population respectively. Moreover, of the 642,215 foreign-born residents in 2011, 48% were male and 52% were female. However, the gender distribution of the foreign-born differed somewhat depending on the age group; a slight majority of the both those aged 0-19 were men. Non-UK born residents within the other age-groups were more likely to be women, and this likelihood increased with age.
Figure 1
In 2011, 41.6% of the non-UK born population held a UK passport, and 54.7% held only a non-UK passport. The rest (3.7%) held no passport
In 2011, 16.7% of all residents of the East of England held no passport. At the same time, 76.6% held a UK passport and 6.6% (388,664 usual residents) held only a non-UK passport (see Table 1). It is important to note that for residents with dual passports, priority was given to UK passports and then Irish passports in the census data collection process. Thus, respondents with both a UK and a non-UK passport are included as having a UK passport. In terms of the foreign-born population, 41.6% of the non-UK born population (267,269 residents) held a UK passport, while 54.7% (351,199 residents) held only a non-UK passport (see Figure 2). Only 3.7% of the foreign-born population (23,474 residents) held no passport.
Figure 2
The Luton unitary authority had the highest number (62,872) as well as the highest population share (31%) of non-UK born residents in the region
As shown in Figure 3, out of all the districts and unitary authorities of the region, the Luton unitary authority had the highest number of non-UK born residents, with 62,872 foreign-born residents in 2011. Luton was also the locality with the highest population share (31%) of non-UK born residents in the region, and its foreign-born population accounts for nearly 10% of the total foreign-born population of the East of England. This was followed by the Peterborough unitary authority, with 37,892 non-UK born residents in the area in 2011, representing 21% of the locality’s usual resident population. In terms of the population share, however, Cambridge comes out second after Luton, with 36,381 non-UK born residents in 2011 representing 29.4% of the local population.
Conversely, the smallest proportion of the foreign-population lived in the district with the smallest foreign-born population was Maldon in the county of Essex, with 2,413 non-UK born residents representing 4% of the local population and 0.4% of East of England’s non-UK born population.
In terms of non-UK passports held, Luton also had the highest number of residents with only a non-UK passport in 2011, with 36,110 residents with only a foreign passport, accounting for 18% of the local population and 9.3% of all those with a non-UK passport in the East of England (see Figure 3). In terms of the population share of foreign- passport holders, however, Cambridge comes out as the top locality, with 22% of residents (27,192 people) holding only a non-UK passport in 2011.
In this measure, the county of Essex had the smallest percentage of residents with only a non-UK passport in 2011, with the 55,542 residents representing 4% of the local population. At the more local level, the locality with the smallest number of non-UK passport holders was again the district of Maldon, with the 1,088 residents with foreign-passports accounting for 1.8% of the area’s population.
Figure 3
While there were 642,215 non-UK born persons usually resident in the East of England in 2011, there were also 15,755 short term residents (defined as staying between 3 and 12 months) born outside of the UK in the region in the same year. While Luton had the largest foreign-born usual resident population, in terms of short-term residents, Cambridge was the top locality in the region with 3,187 short terms residents, amounting to 21% of all the non-UK born short term residents in the East of England.
Between 2001 and 2011, the total non-UK born population grew the most in Luton (26,610 additional non-UK born residents), but the biggest percentage increase in the non-UK born population occurred in Fenland (a 211% increase)
Figure 4
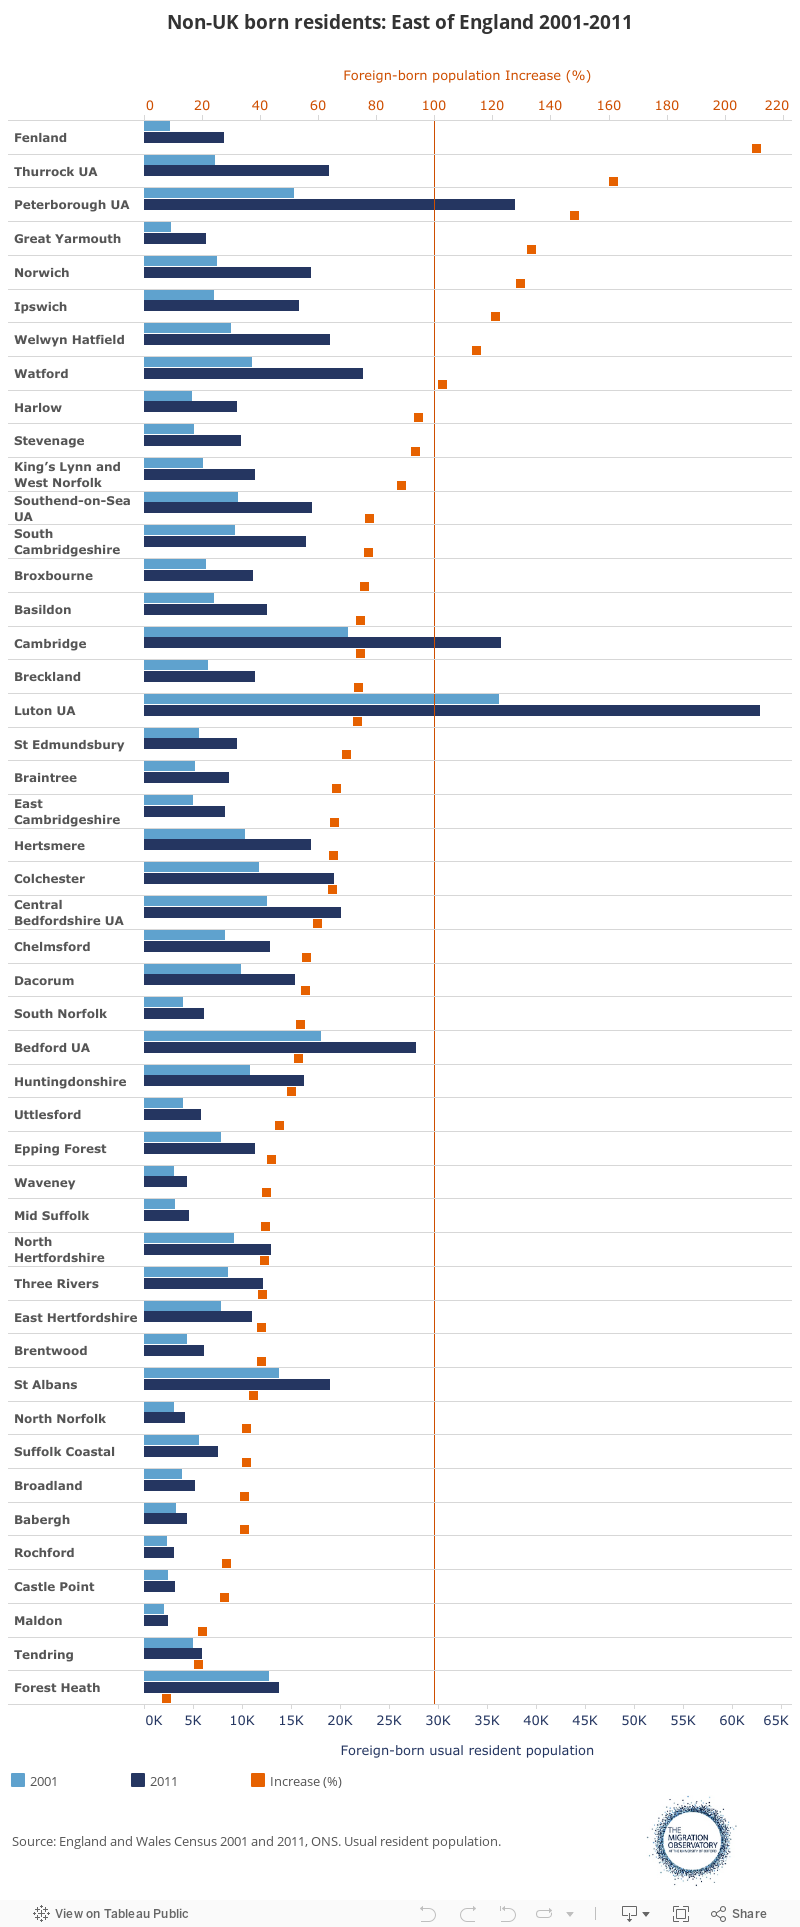
Between 2001 and 2011, the non-UK born population increased in each county, district and unitary authority within the East of England, but to varying degrees and at different speeds (see Figure 4). The largest numerical increase took place in Luton, with the number of foreign-born residents rising by 62,610 persons. However, since the non-UK born population was already the largest in the region in 2001, this rise represents an increase of 57%, below the overall regional growth of 70%.
Figure 5
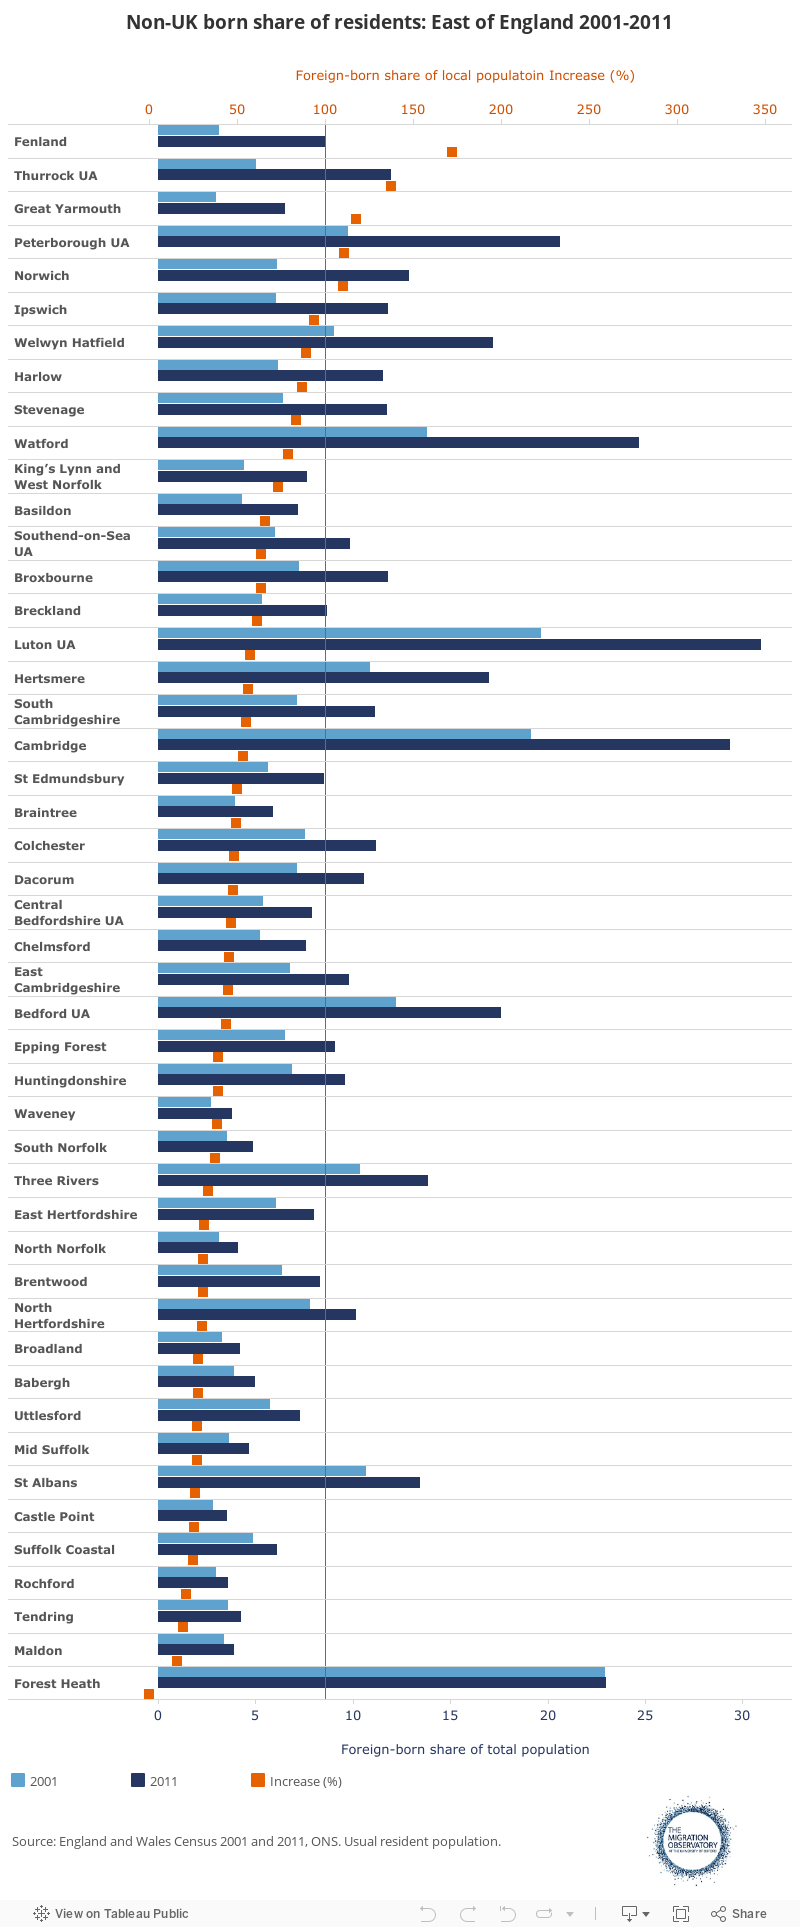
The biggest percentage increase in the non-UK born population occurred in the district of Fenland, where the non-UK born population grew by 5,568 residents (from 2,641 in 2001 to 8,209 in 2011), representing a growth of 211%. At the same time, the non-UK born population has grown the least in Maldon, increasing by 403 residents; this represents a rise of 20%, numerically the lowest in the region. The lowest percentage increase, however, took place in Forest Heath, where the non-UK born population grew by 7.7% in the decade.
As shown in Figure 5, although the non-UK born population has increased in each area of the East of England since 2001, its distribution within the region has changed somewhat since 2001. In terms of the foreign-born as a proportion of the total resident population within a given area, the highest increase (from 3.2% to 8.6%, a 173% increase) also took place in Fenland. The area with the lowest change in the share of the foreign-born population within the resident population was also Forest Heath; the share changed minimally, remaining at 23% in both census years.
Residents born in Poland represent the most numerous non-UK born group in the East of England (62,100 residents) followed by residents born in India, Ireland, United States and Pakistan
As shown in Figure 6, residents born in Poland represent the most numerous foreign-born group in the East of England with 62,100 residents, amounting to 9.7% of the region’s non-UK born population. This is followed by residents born in India (45,257), Ireland (43,682), United States (31,000) and Pakistan (29,598). Within the top 10 countries of birth for the non-UK born population are also Germany, South Africa, Lithuania, Zimbabwe and Bangladesh. The resident population born in these 10 countries represents 48% of total foreign-born population of the region.
Figure 6
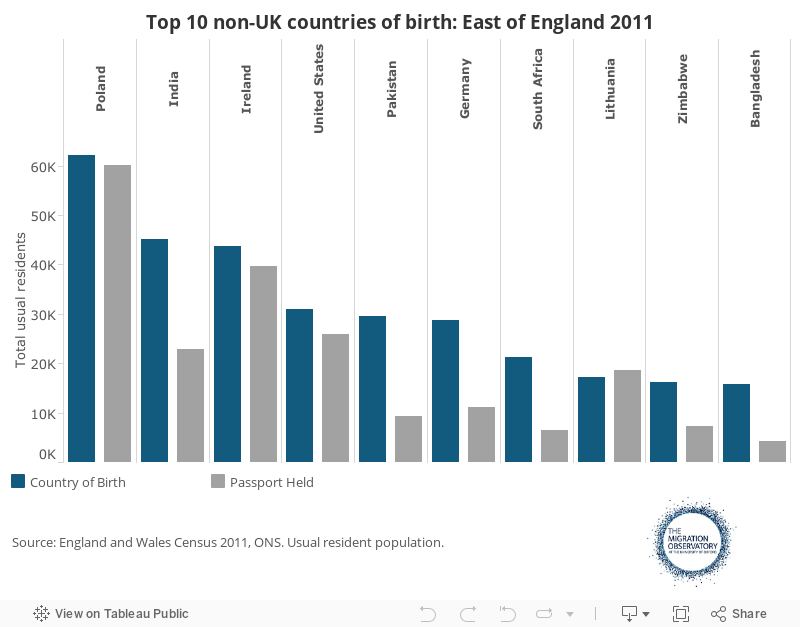
In terms of passports held, residents with Polish passports were also the most numerous group (of those residents that held only a non-UK passport) with 60,195 residents holding a Polish passport in 2011. In this category, residents with Irish passports come second with 39,683 residents and Indian-passport holders come fourth, with 22,807 residents.
Of those residents born in Poland, 86% held a Polish passport only, 4% held a UK passport and 8% held no passport. In terms of residents born in India, 45% held an Indian passport only, while 52% held a UK passport and 1.5% held no passport. The differences in the relationship between the non-UK born and non-UK passport-holders measures in the case of Poland and India can be partly explained, on the one hand, by the fact that EU citizens have less need to acquire UK citizenship as they are not subject to immigration controls and on the other, by the historical differences in migration from these countries. In fact, 89% of Polish-born residents living in the East of England in 2011 arrived in the UK after the 2004 EU expansion (94% since 2001). Conversely, 49% of Indian-born residents living in the East of England in 2011 arrived in the country before 2001; as such they have had more opportunity to become eligible and apply for British citizenship.
Figure 7
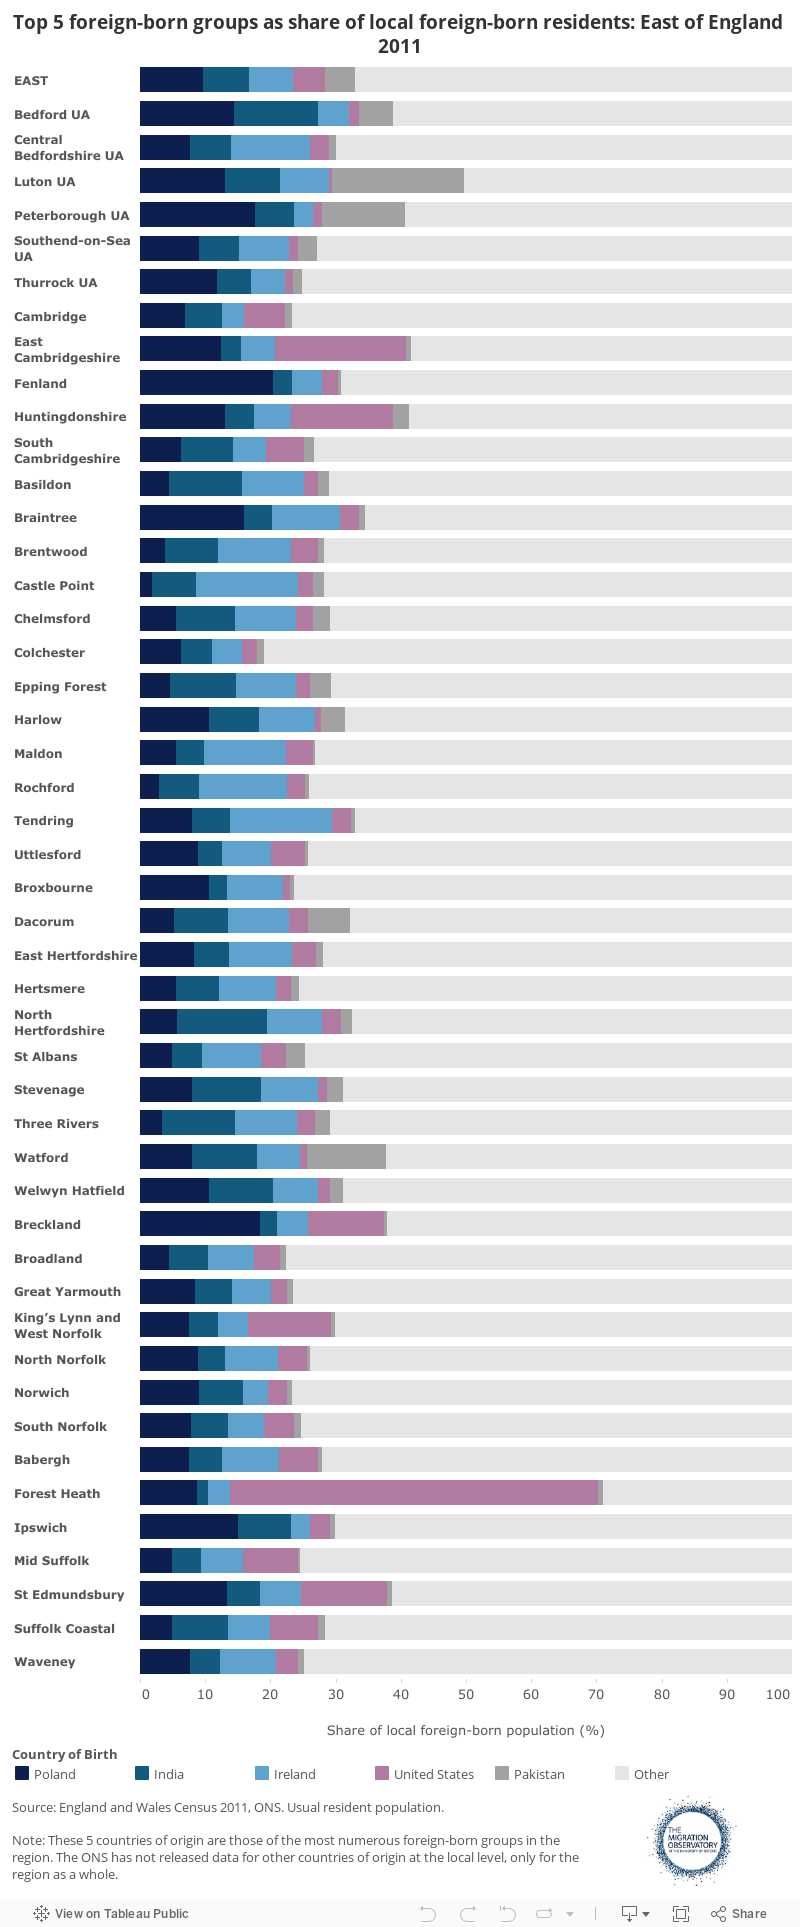
It is important to note that the non-UK born groups were not evenly distributed across the region (see Figure 7). For example, while Hertfordshire county’s residents represented 19% of the population of the region, its Indian-born residents accounted for 28% of all Indian-born of the region. Conversely, while the Luton unitary authority held 3.5% of the region’s population overall, its Polish-born residents represented 13% of all the Polish-born persons living in the region.
As a share of non-UK born within each area of the region, the Indian-born group was the most evenly distributed among the top 5 foreign-born groups. While Indian-born residents accounted for 7% of the foreign-born population of the region, in North Hertfordshire this stood at 14%, the highest in the region, while they represented the lowest proportion of the non-UK born residents in Forest Heath (2%). The Polish-born population was somewhat less evenly distributed. While this foreign-born group accounts for 10% of all the non-UK born residents of the East of England, it represents 20% of local foreign-born in Fenland, while 2% in Castle Point.
The least evenly distributed non-UK born groups among the top 5 groups is that of Pakistani-born residents. While they represent 5% of the non-UK born population of the region, in Luton, they account for 20% of the local foreign-born. Yet in the majority of local areas of the East of England (43 out of 47), Pakistani-born residents represented less than 4% of the local non-UK born, and in the counties of Norfolk and Suffolk, less than 1%. The district of Forest Heath is an interesting example, as 56% of the non-UK born population is accounted for by US-born residents (there are two US Air Force bases in the district).
In terms of main spoken language, 311,238 residents of the East of England (5% of total population) spoke a language other than English as their main language in 2011
There were 311,238 residents of the East of England who spoke a language other than English as their main language in 2011. This total represents 5.3% of the total resident population aged 3 and above. Within this group, the most commonly spoken language was Polish (19%), followed by Urdu (6%), Bengali (with Sylheti and Chatgaya, 5%), Chinese languages (Mandarin, Cantonese and other Chinese languages, 5%) and Lithuanian (5%), to name those languages spoken by 5 or more per cent of those in the East of England who did not speak English as their main language. Table 2 shows the top 15 languages (or language groups) in the East of England. These languages (or language groups) account for 69% of all the languages spoken by those not using English as their main spoken language.
Table 2 – Main spoken language if not English: East of England 2011
| Usual residents | Share (%)* | |
|---|---|---|
| Polish | 58989 | 19% |
| Urdu | 17646 | 5.7% |
| Chinese languages(1) | 16615 | 5.3% |
| Bengali(2) | 15953 | 5.1% |
| Lithuanian | 15797 | 5.1% |
| Portuguese | 14887 | 4.8% |
| Panjabi | 10950 | 3.5% |
| Italian | 9833 | 3.2% |
| French | 8474 | 2.7% |
| Gujarati | 7974 | 2.6% |
| Spanish | 7784 | 2.5% |
| Tagalog/Filipino | 7599 | 2.4% |
| German | 7050 | 2.3% |
| Arabic | 7012 | 2.3% |
| Russian | 6917 | 2.2% |
| Other | 97758 | 31.4% |
| Total | 311238 | 100% |
Among those residents of the East of England who did not select English as their main spoken language in 2011, 42% reported speaking English very well and 38% speaking English well. At the same time, 17% reported not being able to speak English well (1% of all residents above the age of 3); while 3% reported they couldn’t speak English at all (0.2% of all residents above the age of 3). Compared to the whole of England and Wales, foreign-born residents in the East of England report a marginally higher English proficiency. While 80% of those who did not speak English as their main language in the region stated they could speak English very well or well, for England and Wales as a whole, this was 79% (this includes those who did not speak English or Welsh as their main language in Wales).
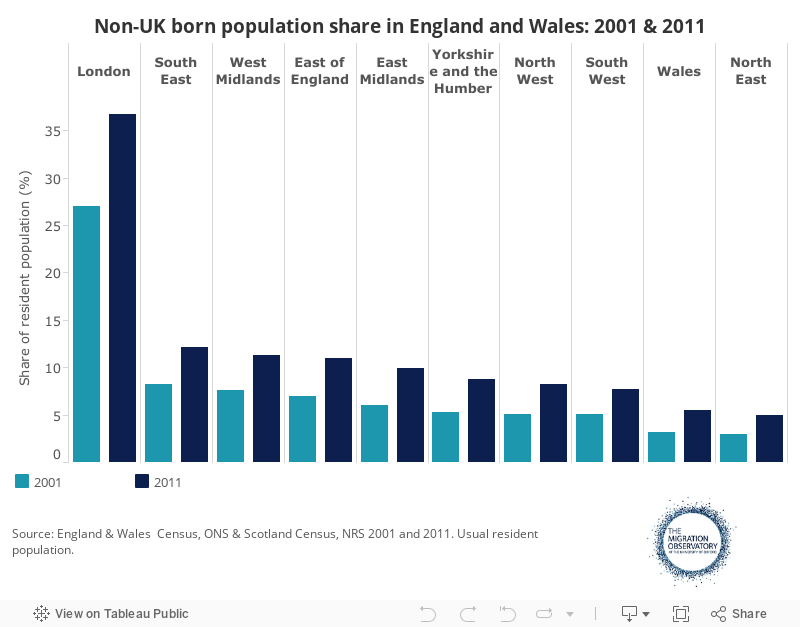
In 2011, the East of England occupied the 3rd position in terms of the population numbers and the 4th position in terms of the population share of non-UK born residents, out of the ten regions of England and Wales
In terms of a regional comparison, in 2011, the East of England held the 3th position among regions of England and Wales concerning the number of non-UK born residents, up from 4th position in 2001 (see Figure 8). In 2011, the number of foreign-born residents in the East of England (642,215 residents) was about 5 times lower than London’s 3 million foreign-born (the region with the highest number of foreign-born residents in England and Wales), while about 5 times higher than in the North East, the region with the lowest proportion of non-UK born population, where there were about 128,000 people born outside of the UK in 2011.
Figure 8
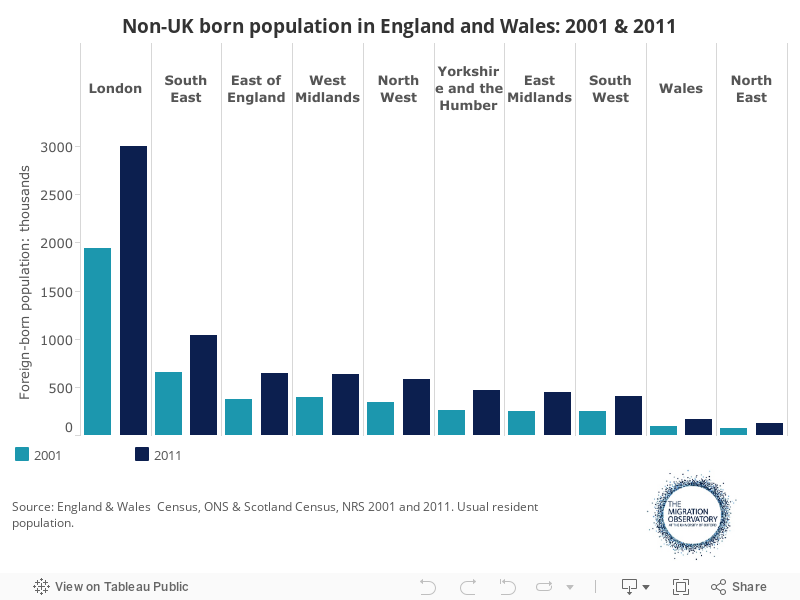
In terms of the share of the foreign-born population within the total regional population, the East of England occupied the 4th position of the 10 regions of England and Wales in both 2001 and 2011 (see Figure 9) – in 2011, this stood at 11%. The regions with the lowest share of the foreign-born population were Wales and the North East, where those born outside of the UK made up 5.5% and 5% of the residents respectively. On the other hand, the region with the highest proportion of non-UK born residents was London (37%), followed by the South East (12.1%).
Figure 9
Evidence gaps and limitations
There are two main limitations of the census. Firstly, it is typically only conducted every 10 years. Therefore, other sources of information are important in order to update the information between censuses. Secondly, there are only a limited number of questions included in the census. Therefore, sources of information on the broader characteristics of the population can also complement the census information.
While the census aims to include the entire population, it does have a certain margin of error. For England and Wales as a whole, the relative confidence interval at the 95% confidence level published by the ONS was 0.15% (83,000 people more or less than the estimate). To give an example at the more local level, for Luton’s usually resident population, the relative confidence interval at the 95% level was 2.37%, suggesting a 95% probability that the true value of the population lies somewhere between 208,024 and 198,378 persons (ONS, 2012). Specific confidence intervals are not currently available for census data relating to country of birth.
References
- Office for National Statistics. “Detailed country of birth and nationality analysis from the 2011 Census of England and Wales.” London, May 2013.
- Office for National Statistics. “Confidence Intervals for the 2011 Census.” London, December 2012.
Related material
- Migratio Observatory briefing – Who Counts as a Migrant? Definitions and their Consequences
- Migration Observatory briefing – Geographical Distribution and Characteristics of Long-Term International Flows to the UK
- Migration Observatory briefing – Migrants in the UK: An Overview