
This briefing provides data on migrants’ labour market integration and the jobs they do in the UK labour market. It also presents data on migrants’ employment and unemployment rates, occupational status, earnings, and contract types.
-
Key Points
- In the fourth quarter of 2022, 6.2 million foreign-born people were employed in the UK, making up nearly a fifth of the working population
More… - Migrant men were more likely to be employed than UK-born men, but among women, migrants were less likely to be in employment
More… - Unemployment rates increased sharply among migrants during the COVID-19 pandemic for both migrants and the UK-born, but had largely returned to 2019 levels by the end of 2022
More… - Unemployed migrants were less likely to claim unemployment benefits than unemployed people born in the UK
More… - Non-EU born migrants who moved to the UK seeking asylum were less likely to be employed than those who moved for employment, family or study reasons
More… - Migrants are over-represented in the hospitality sector, transport and storage, and information, communication and IT
More… - Workers born in North America and Oceania or India were more likely to be in high skilled occupations than the UK-born, while those born in new EU member states (EU-8 and EU-2) were more likely to be in occupations classified as low-skilled
More… - Employees born in North America and Oceania and India had the highest median earnings in 2022
More… - Many highly educated migrant workers are overqualified for their jobs
More… - The share of workers in part-time jobs because they could not find a full-time position was 6% for those born in South Asian countries, excluding India, and 2% for UK born workers
More… - Foreign-born workers were more likely to work during night shifts and in non-permanent jobs than the UK born
More…
- In the fourth quarter of 2022, 6.2 million foreign-born people were employed in the UK, making up nearly a fifth of the working population
-
Understanding the Evidence
This briefing examines the labour market situation of people who were born abroad and have migrated to the UK. ... Click to read more.The word ‘migrant’ is used differently in different contexts. In this briefing, we use the term ‘migrant’ to refer to the foreign-born, regardless of whether they have become UK citizens. For a discussion of this terminology, see the Migration Observatory briefing Who Counts as a Migrant: Definitions and their Consequences.
This briefing relies on data from the Labour Force Survey (LFS) for 2007 to 2022 and the Annual Population Survey (APS) for 2022. The LFS is the largest household study in the UK and provides the official measures of employment and unemployment. The APS includes most of the same individuals as the LFS but also an additional boost to the sample. However, Some variables are unavailable in the APS, and in those cases, this briefing uses the LFS instead. The LFS/APS have some important limitations. Some people are excluded, such as residents of communal establishments like hostels, and other groups may be undercounted due to survey non-response.
Due to the coronavirus pandemic, face-to-face interviewing was suspended on 17 March 2020, and respondents have been interviewed by telephone ever since. This change in the mode of data collection impacted the survey response rate, which has been significantly lower, and the non-response bias (that is, the profile of people who do not participate in the survey has changed). To increase the response rate, the ONS introduced the ‘knock to nudge’ system in April 2021, where interviewers encourage respondents to provide their phone number or arrange an appointment by knocking on their door (Office for National Statistics, 2021a)
The ONS provided revised data with new population weights in 2021 to address the pandemic’s impact (see Office for National Statistics, 2021b). The Office for National Statistics (ONS) and the Migration Observatory have also published several pieces discussing the effects of the pandemic on the LFS/APS data collection and the reliability of the population estimates derived from those surveys (e.g. Athow, 2021; Sumption, 2021).
Labour market variables in the LFS/APS
To indicate the skill level associated with a person’s job, this briefing uses a four-category classification based on the required training developed by the Office of National Statistics (Office for National Statistics, 2020). This classification is based on the Standard Occupational Classification 2020 (SOC 2020) and distinguishes between low-skilled, medium-low skilled, medium-high skilled and high-skilled occupations. In this context, job skills mainly indicate the duration of education and training required to perform a job and do not consider other types of personal skills valued in the labour market.
Earnings information in the APS is the self-reported gross weekly pay for the ‘reference week’ that interviewees are asked information about. To estimate yearly income, this briefing calculates annualised figures, i.e. multiplies gross weekly pay by 52. APS earnings figures calculated in this way are lower than other official earnings figures taken from a different ONS data source, the Annual Survey on Hours and Earnings (ASHE). This is thought to be due to factors such as greater error in self-reporting of salaries in the LFS and differences in the sample (in particular, ASHE only includes people who have been in their jobs for at least one year). The earnings information in this briefing should thus be considered to be underestimated (Office for National Statistics, 2019).
Margins of error in the estimates
Because the LFS and APS are sample surveys, the estimates come with margins of error. This means minor differences between numbers or percentages may not be statistically significant. However, all the differences between groups described in the briefing text are statistically significant. A difference between two groups is considered statistically significant when the probability that this difference is caused by chance is very small. In that case, we assume that the differences we observe in the data will likely exist in the population. Note that minor differences between estimates for different groups may not be statistically significant if not described in the briefing narrative.
-
Understanding the Policy
The people this briefing examines will have migrated to the UK over the course of several decades under a number of different policy regimes; ... Click to read more.For the majority, work will not have been the main reason for migration (see the Migration Observatory briefing Where do migrants live in the UK for information on the main reason for migration of the foreign-born population). For more information on work visas and people who move specifically for work, see the Migration Observatory briefing, Work visas and migrant workers in the UK.
Across Europe, labour market integration policies focus on recently arrived migrants and could include job search assistance, recognition of foreign qualifications or provision of specific skills, such as language courses or vocational and non-vocational training (Bilgili, 2015). For an overview of European labour market integration policies, see the MIPEX report Evaluating Impact: Lessons Learned from Robust Evaluations of Labour Market Integration Policies.
The UK has no overarching policy on migrants’ labour market integration. However, the 2019 Home Office Integration framework emphasises that positive labour market outcomes are key for migrants’ wider integration process. Policies affecting how well migrants fare in the labour market fall within several areas, ranging from adult skills and welfare-to-work to employment regulations and occupational licensing. Some of these policy areas are managed at the UK level, while others are devolved to Scotland, Wales and Northern Ireland. Some cities and local authorities have integration strategies, focusing specifically on migrants or including migrants as one of several target groups. The Integrated Communities Strategy – Action Plan (HM Government, 2019) summarises a series of initiatives led by the DWP, the MHCLG or the DfE to improve the economic integration of disadvantaged groups. However, this Action Plan only applies to England and does not focus exclusively on the migrant population but mainly on ethnic minorities. For more information about policies on integration, see the Migration Observatory policy primer, Integration.
Foreign-born workers made up nearly a fifth of the employed population in the fourth quarter of 2022
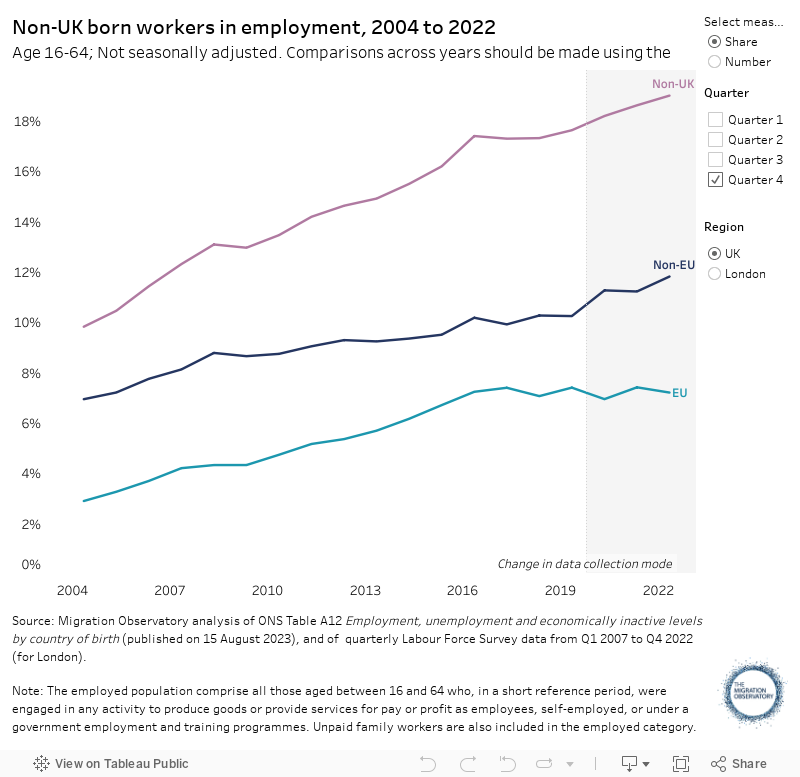
The share of workers employed in the UK who were born abroad has steadily increased over the past two decades, rising from 9% of the employed workforce in the first quarter of 2004 (2.6 million) to 19% in the fourth quarter of 2022 (6.2 million) (Figure 1).
There have always been more non-EU-born than EU-born workers in the UK labour market. The gap in the number of EU and non-EU-born workers narrowed from 2012 to 2016 when EU net migration to the UK was high. However, more recently, non-EU citizens have been the major source of growth in the migrant workforce. This results primarily from the fact that EU net migration remained low after the pandemic while non-EU net migration rose markedly. For more information about net migration from EU and non-EU countries, see the Migration Observatory Briefing, Net Migration to the UK.
Figure 1
Migrant men were more likely to be employed than UK-born men in 2022, but migrant women were less likely to be in employment
Many factors shape the employment rates of migrants in the UK, ranging from migrants’ varying levels of education and skills, how well they speak English, family and caring responsibilities, social networks, the extent to which UK employers recognise their foreign qualifications, and discrimination. More information about English language use among migrants is available in the Migration Observatory briefing, Language Use and Proficiency of Adult Migrants in the UK.
In 2022, the employment rate of working-age migrant men (82%) was higher than that of the UK-born (78%) (Figure 2). Most region-of-origin groups had higher employment rates than UK-born men. Among women, the overall employment rate for working-age migrants was 71%, slightly lower than for the UK-born (73%). However, EU-born women had unusually high employment rates (80%).
Women from MENA, Central Asia and South Asian countries, excluding India, were far less likely to be employed, with looking after the family home the primary reason: among women from these regions who were not in employment in 2022, 43% of those born in MENA, Central Asia cited this as the reason they were not employed, as did 59% of women who were born South Asian countries excluding India.
Figure 2
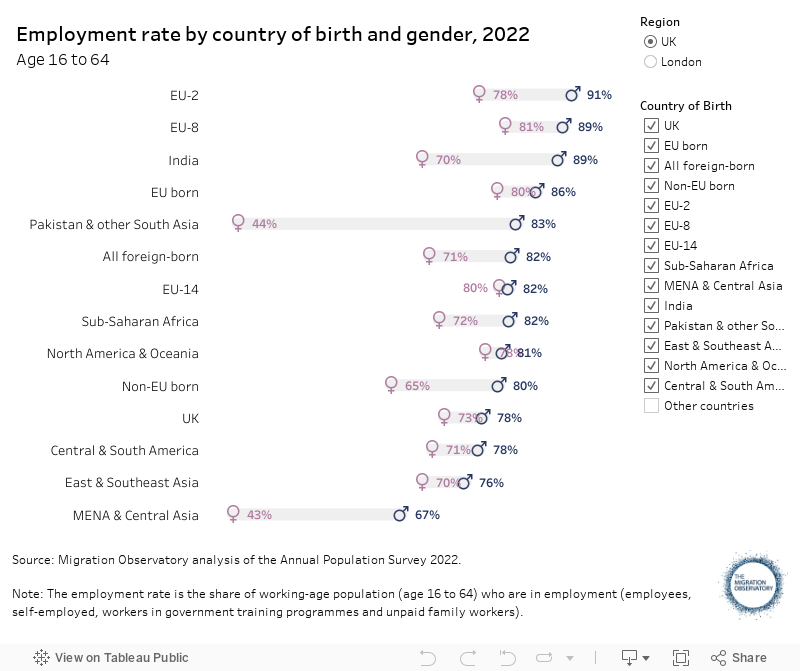
The gender employment gap—the difference between the employment rates of men and women—is smallest among the working-age population born in EU-14 countries and North America and Oceania and largest among migrants born in South Asian countries, excluding India, for which women’s employment rate was almost 40 percentage points lower than that of men (Figure 2).
Unemployment rates increased sharply among migrants during the COVID-19 pandemic but had largely returned to 2019 levels by the end of 2022
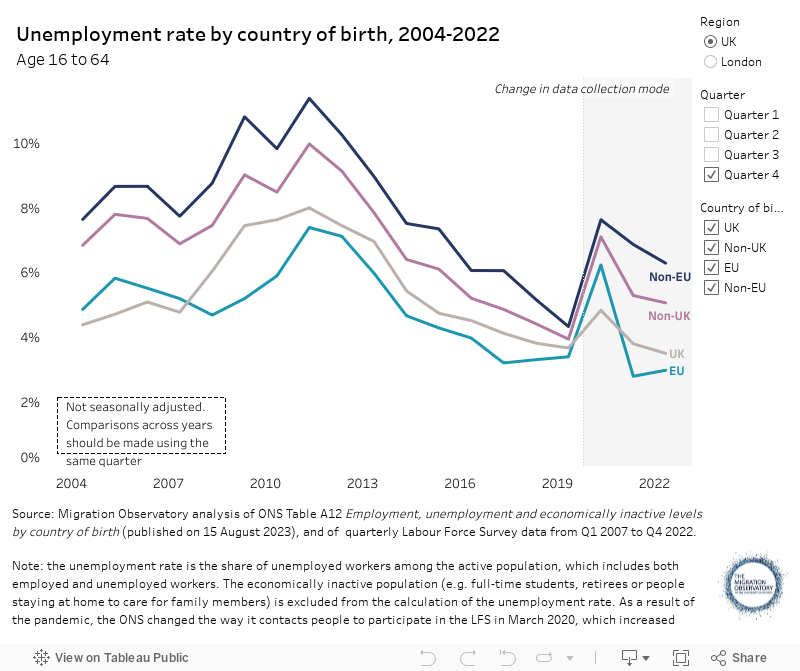
Unemployment rates have generally followed similar trends for both migrants and UK-born over the past two decades, with sharp increases in the aftermath of the 2008 financial crisis and steady declines from 2012 to 2019 (Figure 3). The unemployment rate tended to be lower among EU migrants than the UK-born from 2008 until the beginning of the pandemic, while non-EU migrants have always had higher unemployment rates than their UK-born counterparts.
The economic downturn caused by the COVID-19 pandemic led to a steep rise in the unemployment rates of both UK- and foreign-born workers, which peaked at the end of 2020 and the beginning of 2021. By the end of 2022, however, the unemployment rate for migrants had fallen to 5%.
By this point, EU- and UK-born residents experienced lower unemployment rates than before the pandemic, while the rate for non-EU citizens remained higher (around 6%).
Figure 3
The greater increase in unemployment among migrant workers—especially the EU-born—compared to the UK-born during the pandemic may have been related to differences in the jobs they do. Migrants were over-represented in the hospitality sector, which was impacted substantially by the pandemic. They were also more likely to be on non-permanent contracts (Office for National Statistics, 2021c). During the pandemic, people with temporary contracts or less secure work arrangements were more likely to lose their jobs. For more information, see the Migration Observatory report Migrants’ labour market profile and the health and economic impacts of the COVID-19 pandemic).
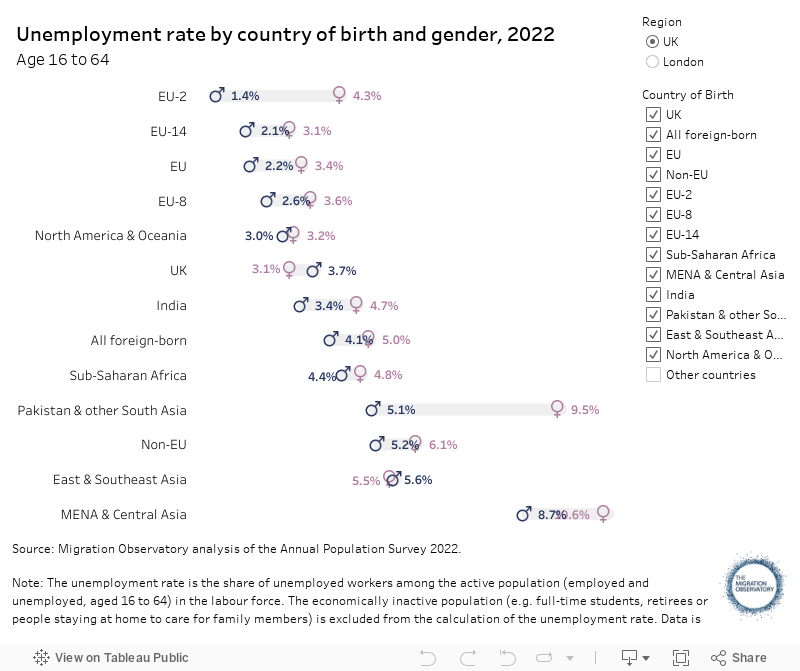
As with employment, unemployment rates vary widely by country of birth and gender (Figure 4).
Figure 4
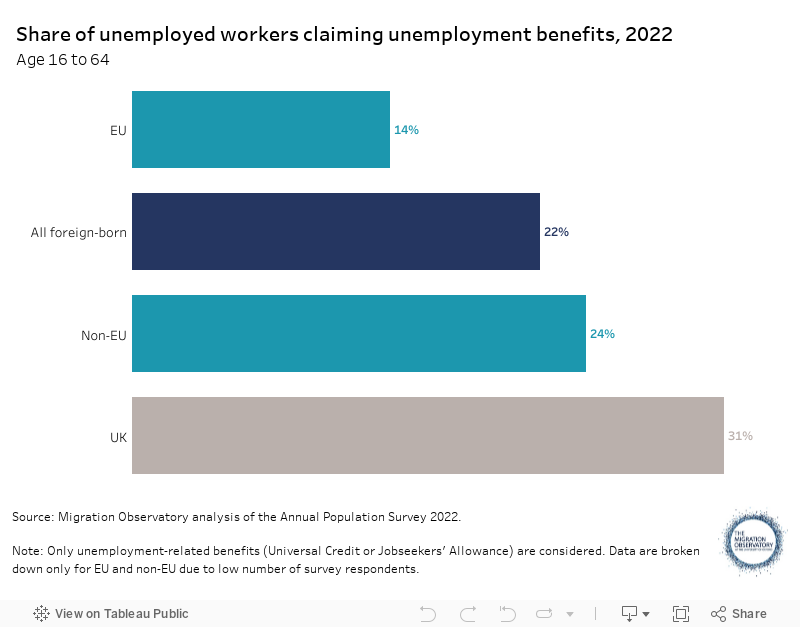
Migrants were less likely to claim unemployment benefits than the UK born in 2022
Unemployed migrant workers were less likely to claim unemployment benefits than UK-born workers during 2022 (Figure 5). There are several possible reasons for this pattern:
- Some migrants are not eligible to claim benefits. Most non-EU citizens who are not permanently settled residents—including skilled workers and international students—are ineligible for income-based Jobseekers’ Allowance and Universal Credit, as are EU citizens who moved to the UK after 31 December 2020 and do not have pre-settled or settled status. For more information about which migrants are eligible to claim benefits, see the Migration Observatory briefing, Deprivation and the no recourse to public funds (NRPF) condition.
- Migrant workers eligible to receive unemployment benefits may not understand their entitlements or may be unfamiliar with the process of claiming or visiting job centres.
- Migrants were less likely to be unemployed for long periods. In 2022, 26% of those born in the UK who were unemployed had been so for over a year, compared to 20% of non-EU migrants and 15% of EU migrants.
Figure 5
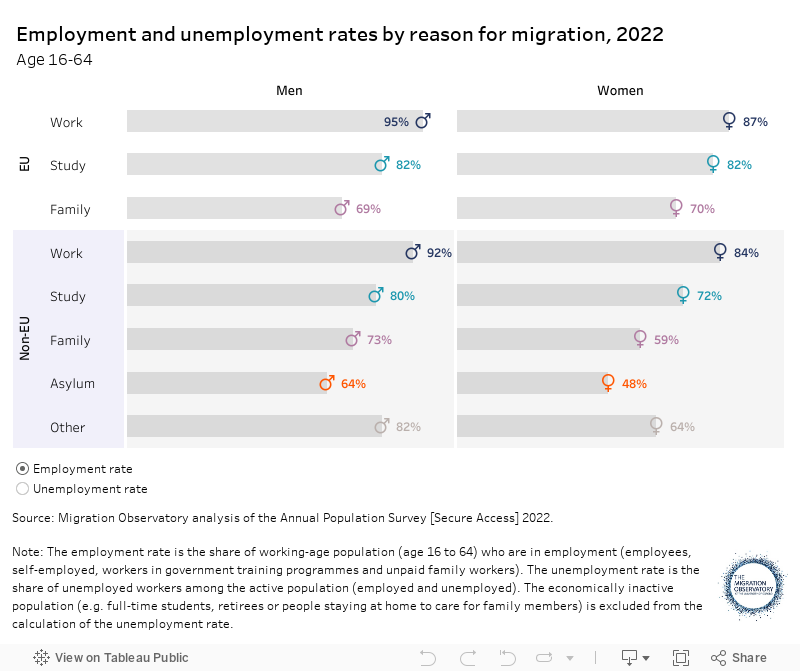
Non-EU-born migrants who moved to the UK seeking asylum were more likely to be unemployed than those who moved for employment, family or study reasons
Migrants who came to the UK for work were the most likely to be employed and the least likely to be unemployed in 2022. Among non-EU migrants, those who initially came to the UK seeking asylum had both a lower employment rate and a higher unemployment rate than other non-EU migrants (Figure 6). Several factors may have contributed to this, including that refugees tend to have smaller social networks to support the process of finding a job and often have a lower health status, particularly in terms of mental health (Ruiz and Vargas-Silva, 2018). There is also some evidence that restrictions on asylum seekers working while their applications are being processed can lead to worse outcomes in the labour market in the long run.
Figure 6
Migrants are over-represented in the IT and communications, transport and storage, and hospitality sectors
In 2022, nearly one in five workers born in non-EU countries worked in the health and care sector (19%), almost twice as many as the next most common sector: retail (10%) (Figure 7). Workers born in Sub-Saharan Africa and East & Southeast Asia were more likely to work in health and care than any other region-of-origin group, although workers from these regions did different types of work in the sector: 42% of Sub-Saharan Africans were care workers, while 40% of East & Southeast Asians were working as nurses.
By contrast, EU workers were more evenly distributed across sectors, with manufacturing, retail, health, and care the most common. Almost a third of workers born in EU-8 countries were working in either retail or manufacturing jobs in 2022, while workers from EU-14 countries were most likely to work in education.
Figure 7
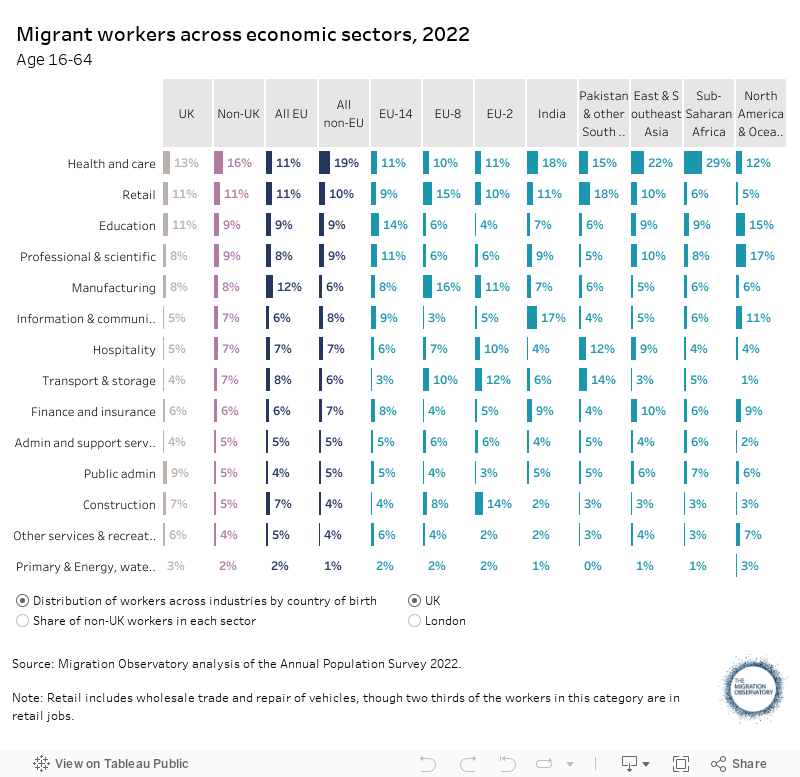
Around a fifth of the employed workforce in 2022 were migrants, but their presence varied considerably across sectors. For example, migrants were over-represented in the IT and communications, transport and storage, and hospitality sectors and under-represented in public administration.
EU-8 workers made up only 1% of the working-age population in employment but represented 6% of workers in the transport and storage sector. Indian workers were over-represented in the IT and communication sector, which includes jobs such as computer programmers.
Workers born in North America and Oceania or India were more likely to be in high-skilled occupations than the UK-born, while those born in new EU member states (EU-8 and EU-2) were more likely to be in low-skilled occupations
Taken as a whole, the occupational distribution of migrant workers did not differ much from that of UK-born workers in 2022, although migrants were slightly more likely to be working in jobs classed as both high- and low-skill than the UK-born (Figure 8). In this context, job skills mainly indicate the educational credentials and training required to perform a job and do not consider other types of personal skills valued in the labour market. A majority of both migrants and UK-born workers were in middle-skilled jobs, which included occupations such as associate professionals, administrative jobs, sales assistants and some care work.
There are considerable differences in the type of jobs that workers do by region of birth. Over half of workers born in North America, Oceania, and India were in high-skilled jobs in 2022, the most common of which among the overall migrant population were IT specialists, teachers, managers, and nurses. By contrast, fewer than 1 in 5 workers born in new EU accession countries (EU-8 and EU-2) were working in high-skill jobs. Migrants from these countries are most likely to work in low-skill occupations, including cleaners, waiters, and packers (Figure 8).
Figure 8
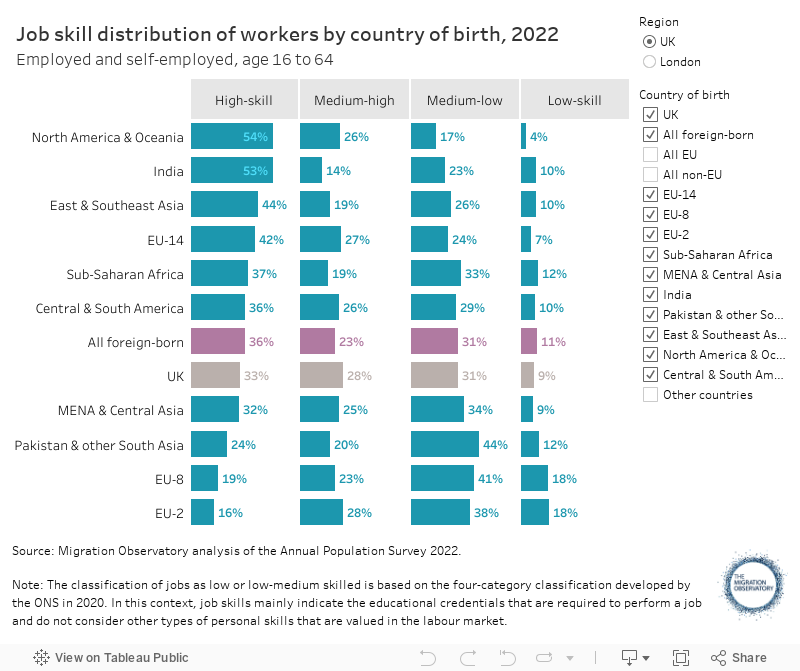
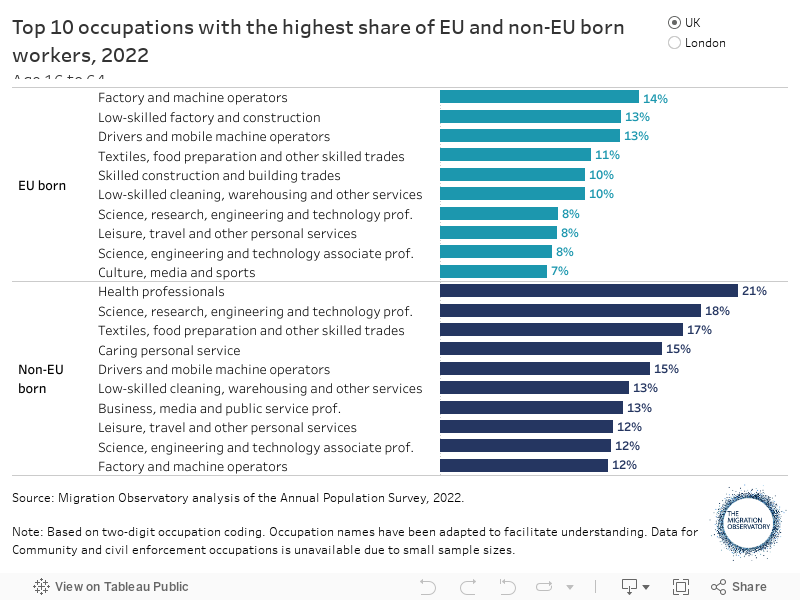
Figure 9 shows the ten occupations that were most reliant on workers born in EU and non-EU countries, respectively. Factory and machine operators—which includes jobs such as machine operators in food factories and assemblers—had the largest share of EU-born workers in 2022. By contrast, health professional jobs like doctors and nurses had the highest share of non-EU workers.
Figure 9
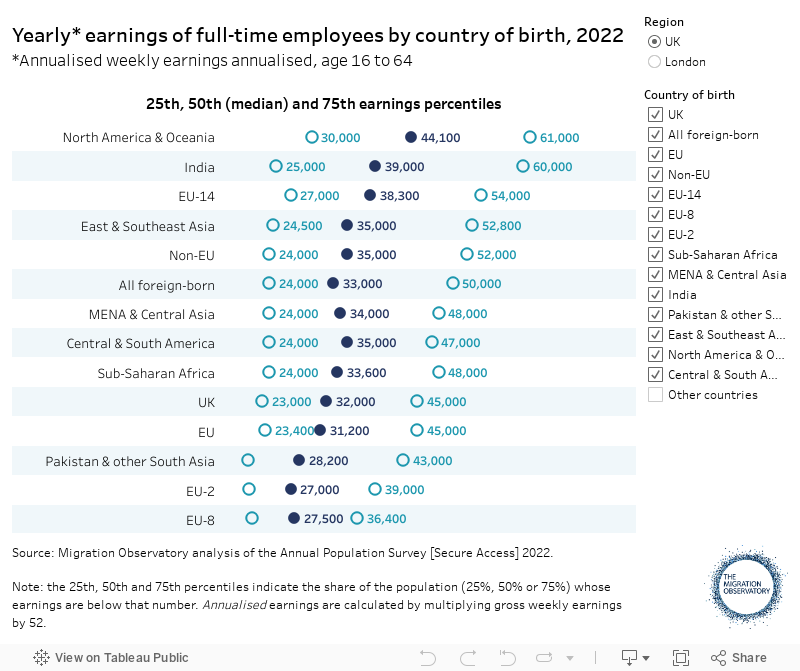
Employees born in North America, Oceania and India had the highest annualised median earnings in 2022
Workers’ earnings are closely related to the occupations they hold. Migrant groups most concentrated in high-skilled jobs also tend to have higher earnings (Figure 10). Most non-EU region-of-origin groups had higher earnings than that of the UK-born in 2022—the only exception was full-time employees from South Asian countries, excluding India. Migrants born in new EU member states (EU-8 and EU-2) had the lowest median earnings.
Figure 10
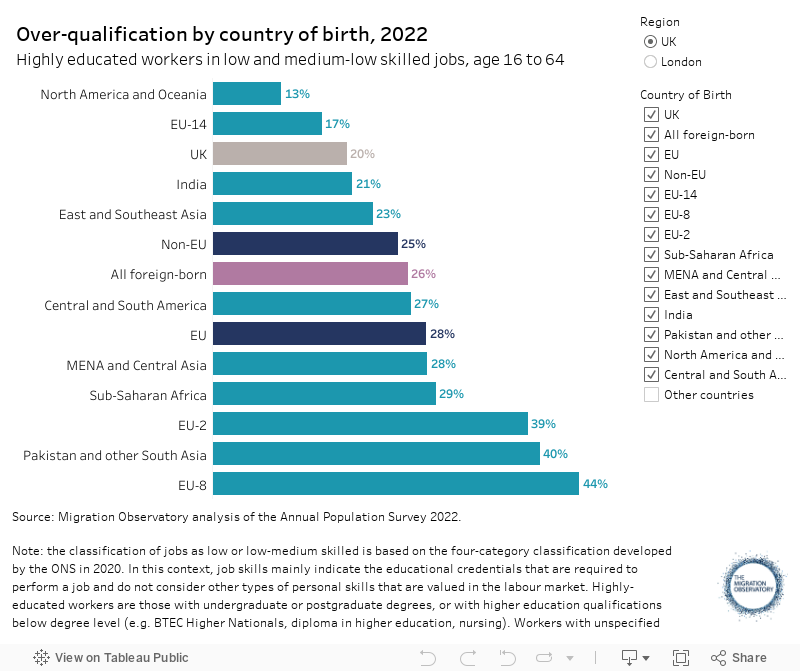
Highly educated migrant workers are often overqualified for their jobs
Compared to the UK-born, migrants are more likely to work in jobs for which they were overqualified—i.e. their education level is above that typically required for the job. The indicator of over-qualification used here shows the share of highly educated workers (those with university degrees or with higher education qualifications below degree level, such as nursing) working in low and medium-low-skilled jobs (Figure 11).
Compared to the UK-born, highly educated workers from most regions of origin were more likely to work in jobs for which they were overqualified in 2022. The only exceptions were people from North America, Oceania, and EU-14 countries. Workers born in South Asian countries, excluding India and the EU-2 and EU-8 countries, were the most likely to be over-qualified. Importantly, the migrant groups with the lowest earnings (see Figure 10) were the most likely to be over-qualified for their jobs.
Some factors explaining migrants’ high over-qualification rates include employers’ failure to recognise foreign qualifications, migrants’ lack of information about the job searching process in the UK, or a lack of UK-specific skills, such as language ability.
Figure 11
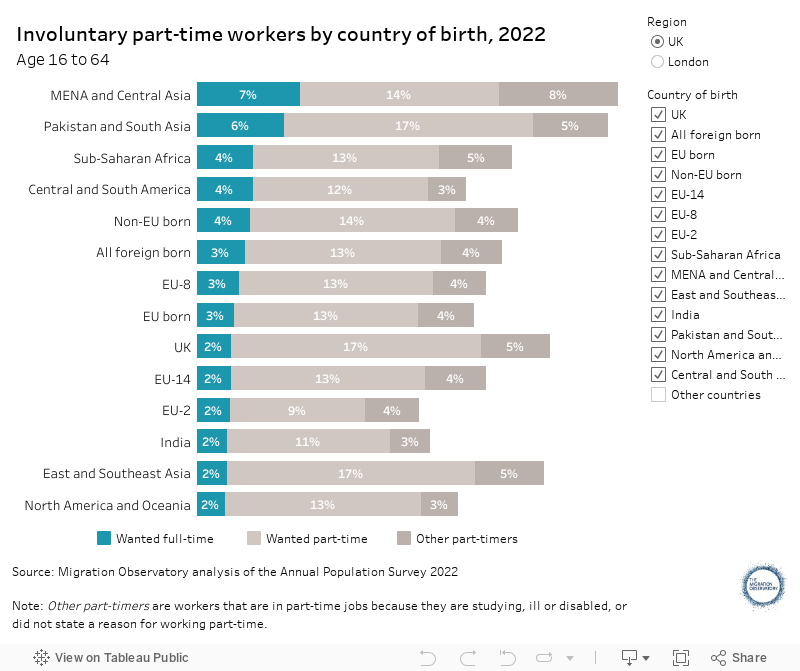
In 2022, the share of workers in part-time jobs because they could not find a full-time position was 6% for those born in South Asian countries, excluding India, and 2% for UK-born workers
The share of workers who were in part-time jobs in 2022 because they could not find a full-time job was relatively low for both the UK-born (3%) and migrants as a whole (4%) (Figure 12). However, the share of involuntary part-time workers was higher for those born in South Asian countries, excluding India (6%).
Figure 12
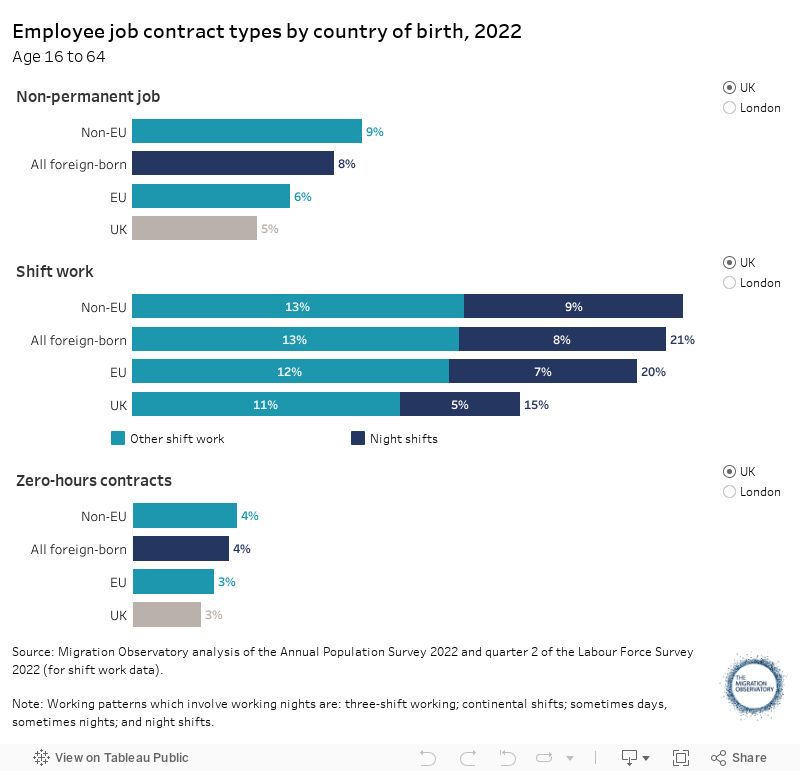
Foreign-born workers were more likely to work during night shifts and in non-permanent jobs than the UK-born
Shift work takes place outside typical working hours (9 am to 5 pm) from Monday to Friday. It could involve working on different time schedules each day of the week, on weekends, split shifts (e.g. full shifts divided into two distinct parts with a gap of several hours in between) or during nighttime. Shift schedules are more common in sectors that require 24-hour service (e.g. nursing and care homes) or where service is concentrated at certain times of the day (e.g. restaurants, night clubs).
In 2022, foreign-born workers were more likely to work in jobs involving some kind of shift work than the UK-born, and they were more likely to work during night shifts (Figure 13). Night shift work is thought to have a negative impact on physical and mental health and performance through its impact on sleep and circadian timing (The Parliamentary Office of Science and Technology, 2018).
Migrant workers were also more likely to be in non-permanent jobs, and the share of workers with zero-hour contracts—although small—was higher among migrants (Figure 13). Around half of migrants with zero-hours contracts work in cleaning, warehousing, social care, or large goods vehicle driving.
Figure 13
Evidence gaps and limitations
The LFS does not collect data on earnings from self-employment, so it cannot provide the full picture of migrants’ earnings in the UK. In addition, the estimation of annualised median earnings for each country grouping does not exactly match the official estimates, which are based on the Annual Survey of Hours and Earnings (see ‘Understanding the Evidence’ above).
The aggregate occupational categories used in this briefing (e.g., high-skilled or low-skilled) are also imperfect as a measure of occupational skills. While using aggregated occupational groups is useful for providing an overview of the skills required to perform a certain job, in practice, they can contain a wide range of occupations, including workers with quite different levels of education, pay or working conditions.
A limitation of using cross-sectional data such as the LFS/APS is that we cannot follow individuals over time, and, therefore, we do not know whether migrants’ labour market position has improved or worsened since their arrival to the UK. In general, migrants’ integration into the labour market will likely improve the longer they stay in the UK.
Acknowledgements
This report was originally produced with the support of the Paul Hamlyn Foundation. It was updated in 2022 and 2023 with the support of Trust for London, which is one of the largest independent charitable foundations in London and supports work that tackles poverty and inequality in the capital. More details at www.trustforlondon.org.uk.
References
- Athow, J. (2021). Carry that weight: Reducing the effects of COVID-19 on the Labour Force Survey. News and insight from the Office for National Statistics. Published on 8 October, 2021. Available online
- HM Government (2019). Integrated Communities Action Plan. Available online
- OECD/European Union (2015), Indicators of Immigrant Integration 2015: Settling In, OECD Publishing, Paris. Available online
- Office for National Statistics (2021a). Force Survey Performance and Quality Monitoring Report: April to June 2021. Available online
- Office for National Statistics (2021b). Labour Force Survey weighting methodology. Available online
- Office for National Statistics (2021c). Coronavirus and the impact on payroll employment: experimental analysis. Available online
- Office for National Statistics (2020). Coronavirus and its impact on the Labour Force Survey. Published on 13 October 2020. Available online
- Office for National Statistics (2019). A guide to sources of data on earnings and income. Available online
- Office for National Statistics (2020). Standard Occupational Classification 2020: Volume 1 Structure and descriptions of unit groups. Available online
- Office for National Statistics, Social Survey Division. (2023). Annual Population Survey, 2004-2022: Secure Access. [data collection]. 29th Edition. UK Data Service. SN: 6721, DOI: http://doi.org/10.5255/UKDA-SN-6721-28
- Parliamentary Office of Science & Technology (2018). Shift work, sleep and health, number 586. Available online
- Ruiz, I., & Vargas‐Silva, C. (2017). Are refugees’ labour market outcomes different from those of other migrants? Evidence from the United Kingdom in the 2005–2007 period. Population, Space and Place, 23(6). Available online
- Ruiz, I., & Vargas‐Silva, C. (2018) Differences in labour market outcomes between natives, refugees and other migrants in the UK, Journal of Economic Geography, volume 18, Issue 4, pp 855–885. Available online
- Sumption, M. (2021). Where did all the migrants go? Migration data during the pandemic. Migration Observatory commentary. Available online.
- Week, A., Fallows, A., Broad, P., Merad, S., & Ashworth, K. Non-response Weights for the UK Labour Force Survey? Results from the Census Non-response Link Study. Survey Methodology and Statistical Computing, Office for National Statistics. Available online
Further readings
- Anderson, B., & Ruhs, M. (2012). Reliance on migrant labour: inevitability or policy choice? The Journal of Poverty and Social Justice, 20(1), 23
- Chiswick, B. R., & Miller, P. W. (2008). Why is the payoff to schooling smaller for immigrants? Labour Economics, 15(6), 1317-1340
- Frattini, T. (2017). Evaluating the Labour Market Integration of New Immigrants in the UK. Social Policy and Society, 16(4), 645-658
- Johnston, R., Khattab, N., & Manley, D. (2015). East versus West? Over-qualification and earnings among the UK’s European migrants. Journal of Ethnic and Migration Studies, 41(2), 196-218
- Kone, Z., Ruiz, I. & Vargas-Silva, C. (2019). Refugees and the UK Labour market. Econref working paper 04-2019, Centre on Migration, Policy and Society. Available online
- McCollum, D., & Findlay, A. (2015). ‘Flexible’ workers for ‘flexible’ jobs? The labour market function of A8 migrant labour in the UK. Work, employment and society, 29(3), 427-443
- Migration Advisory Committee. (2014). Migrants in low-skilled work: The growth of EU and non-EU labour in low-skilled jobs and its impact on the UK. Migration Advisory Committee Report
-
Media Coverage
-
The Guardian online (20 Feb 2017)
Thousands of migrant workers to take part in UK's first day of action
-
The Guardian online (20 Feb 2017)