
This briefing covers the scale of immigration and net migration in the UK since the early 2000s and under the post-Brexit immigration system.
-
Key Points
- The UK has experienced broadly similar levels of migration compared to other high-income countries, on average, over the past few decades.
More… - Net migration was unusually high in 2022 and 2023, driven by an increase in non-EU citizens coming to the UK. The majority of the increase in non-EU arrivals from 2019 to 2023 occurred through the study and work routes.
More… - Rising emigration may put downward pressure on net migration from 2024 onwards. For example, increases in study migration have contributed to net migration in the short run, although most international students leave the UK within a few years.
More… - EU citizens made up a majority of immigration and net migration in the run-up to the 2016 EU referendum. By the year ending June 2023, EU net migration was negative, according to official estimates.
More… - Projections of future net migration are inherently uncertain. In the past 20 years, official projections have usually underestimated future net migration levels.
More…
- The UK has experienced broadly similar levels of migration compared to other high-income countries, on average, over the past few decades.
-
Understanding the Policy
The scale of UK migration is affected by immigration policies but also depends on other factors such as the state of the economy here and in countries of origin, demand for international study opportunities, and events and crises around the world. ... Click to read more.Immigration policies tend not to specify the total number of people who can move to a country but simply set eligibility criteria to determine who can qualify for residence. The number of people who meet the criteria will fluctuate over time even when policy does not change. This is one reason it is difficult for politicians to specify exactly what level of net migration they expect in future.
During some periods, specific numerical targets in immigration policy have been in place, however. In particular, the Conservative-led UK governments from 2010 to 2019 had explicit targets to reduce net migration – immigration minus emigration – to under 100,000 a year. In the early 2010s, several policies were introduced to help achieve this target. A brief outline of key policies introduced before the EU referendum can be found in the Migration Observatory commentary, The State of the Nation: the Immigration Numbers Game. The net migration target was never reached and was abandoned at the end of 2019 under Boris Johnson’s government.
In January 2021, a new immigration system was introduced to replace free movement. Under the new system, EU citizens migrating to the UK have been subject to the same immigration rules as citizens from the rest of the world (though Irish citizens continue to have free movement rights under separate legal arrangements). An annual cap on skilled workers was also removed. Overall, the new immigration system is considerably more restrictive towards EU citizens and somewhat less restrictive towards non-EU citizens, compared to the system that existed until the end of the post-Brexit transition period in December 2020. Projections made before this system came into force suggested that it would reduce overall migration, compared to a system in which free movement had continued. These projections did not account for other factors that affect migration trends, such as the war in Ukraine and the establishment of a route for Hong Kong British National Overseas (BNO) status holders; and they did not anticipate the substantial increase in work-visa numbers post-Brexit. For a discussion of the new points-based system, see our Policy Primer: The UK’s 2021 points-based immigration system.
In November 2023, the Home Office announced a suite of policies designed to restrict immigration via several regular routes—including work, study and family—with a view to reducing net migration.
-
Understanding the Evidence
There is currently enormous uncertainty about immigration and net migration to the UK, due to challenges collecting accurate data. ... Click to read more.Broadly speaking, there are three main measures of the scale of migration to the UK:
- Long-term immigration: includes anyone moving to the UK for at least 12 months. This measure is useful because it excludes very short-term migrants such as those who come on work visas for just a few weeks or months.
- Net migration: is calculated as long-term immigration minus long-term emigration (i.e. those moving for at least a year in either direction). It illustrates the contribution of migration to population growth.
- Visa grants: include anyone receiving a visa to live or work in the UK, including those who move for very short periods (although we exclude visitor and transit visas from all the data in this briefing). Visa data only cover people who require visas, which means that before the end of 2020, EU citizens were not included in the figures. This means that they should not be used to examine how the scale of overall migration has changed since the pre-Brexit or pre-pandemic period.
The Office for National Statistics (ONS) have produced different estimates of both long-term immigration and net migration, using different data and methods. In this briefing we provide the overall story told by looking at the different data sources together. The four main methods are as follows:
Experimental estimates using administrative records
ONS has recently developed new methods of measuring migration using administrative data. These include tax and benefits records contained in the Registration and Population Interaction Database (RAPID) and Home Office data on visas granted and entries and exits at the border. These data sources have the potential to improve migration statistics but are not yet labelled National Statistics, and they have important limitations.
For non-EU citizens, recent ONS estimates rely on border data. Non-EU citizens who receive entry visas, enter the UK, and remain for at least 12 months, excluding short trips abroad, are counted as long-term immigrants. Those who leave for at least 12 months are counted as long-term emigrants. For estimates based on the most recent data, ONS cannot yet confirm whether people who leave do so for at least 12 months. As a result, it must make assumptions about how long people will stay. These may not be accurate when behaviour is changing, for example, due to policy changes. This is why provisional estimates can be substantially revised over time.
Exit checks data currently only meaningfully covers non-EU citizens. However, this will change over time as more EU citizens moving to and from the UK are incorporated into the visa system (rather than, for example, the EU Settlement Scheme). Estimates of EU citizens thus currently rely much more on RAPID. Understanding immigration and emigration using the RAPID database requires assumptions about whether people absent from the data have actually left the UK. These assumptions will affect the estimates. The RAPID data will not include people who do not work or receive benefits. Children and students are not counted in the RAPID data either, but in recent migration estimates ONS has made an adjustment to include them. People are classified as migrants in the RAPID database if they were a non-UK citizen when they applied for a national insurance number (NINo). Note that for consistency with other data sources and ONS practices, we describe the data as being for the period “year ending March”. However, in practice the figures actually end with the fiscal year on 6th April.
Estimates from RAPID are also available for the 2012-2020 period for non-EU citizens and are shown in some charts. They are subject to the same caveats.
Experimental ONS estimates also include asylum applicants and resettled refugees. Arrivals are estimated using internal Home Office data on the asylum applications and grants of status for resettlement, with an adjustment made to avoid the double counting of those who applied for asylum after entering the country on a long-term visa. The number of departures is sourced from Home Office data on voluntary and enforced returns of asylum seekers. This category does not include immigration or emigration of people who arrive through irregular routes and never go on to claim asylum, because their numbers are not known.
Immigration and net migration figures based on the International Passenger Survey (IPS)
The main source for immigration and net migration data before the COVID-19 pandemic was the IPS, which had many flaws and limitations but provided a long-term view of changes in migration patterns over periods of more than a decade. The survey, conducted at ports and airports, was based on respondents’ intention to come to or leave the UK for at least one year. Intentions may not be accurate. Indeed, in August 2019, ONS announced that its Migration Statistics Quarterly Report was being reclassified from National Statistics status to Experimental Statistics, to convey a lower degree of reliability. This move followed analysis showing that certain groups, such as non-EU students and Eastern European immigrants, were not being measured accurately.
In March 2020, the IPS was suspended due to the COVID-19 pandemic. Although it was later reinstated, it no longer includes the ‘migrant boost’ module that had previously enabled estimates of immigration and net migration. This has further reduced its reliability. ONS no longer publishes migration estimates based solely on the IPS, although the survey is still used to measure migration of British citizens.
British citizens in the data
Finally, note that headline net migration statistics often include the net migration of British citizens. British citizens have traditionally had negative net migration, i.e. more of them leave than arrive in any given year. Including them in the estimates is useful in some circumstances, for example, to calculate the overall contribution of international mobility to population growth. However, British emigration is generally not very relevant to policy discussions. This briefing provides figures both including and excluding UK citizens.
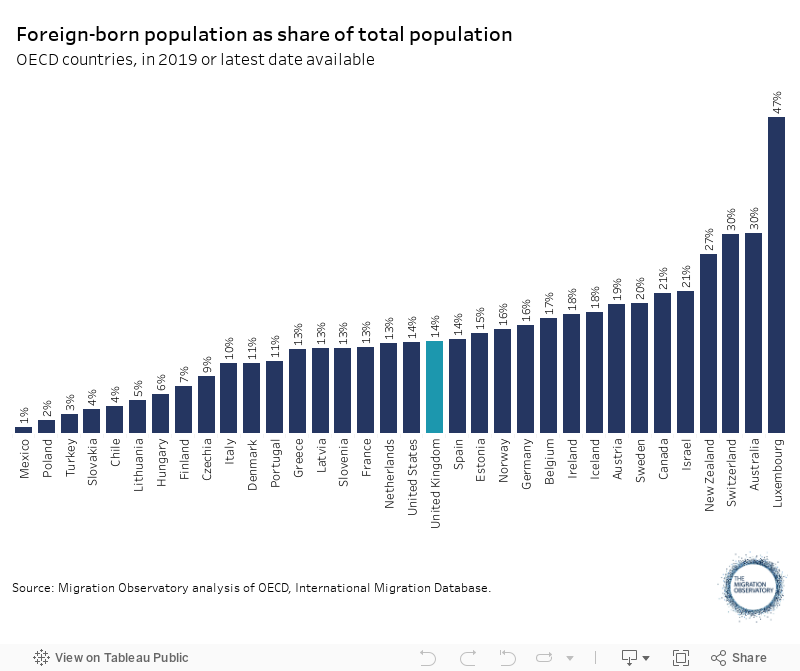
The UK has experienced broadly similar levels of migration compared to other high-income countries, on average over the past few decades
Migration levels fluctuate from year to year, but over long periods, a useful measure of how much immigration a country has experienced is the size of the foreign-born population as a percentage of the population. Countries with high levels of net migration—defined as people immigrating minus those emigrating—develop larger foreign-born or migrant populations over the long run.
By the beginning of the 2020s, the UK’s foreign-born population was approximately 14%. This share is similar to high-income countries such as the United States and Spain (Figure 1). The UK has a smaller foreign-born population than Australia, Canada, and New Zealand. The foreign-born population in Australia, for example, is roughly double that of the UK as a share of the population. By contrast, the UK has a higher share of foreign-born people in the population compared to Italy, Portugal, and most Eastern European countries.
Figure 1
The scale of migration to a country may have some economic impact, but research suggests that the composition of migration is more important than the numbers alone. Whether migrants are working and what skills and qualifications they bring are among the key factors that affect the effects of migration on the economy (MAC, 2018). For more discussion of the economic impacts of migration, see the Migration Observatory briefings, The Fiscal Impacts of Immigration in the UK, and The Labour Market Effects of Immigration.
Net migration was unusually high in the year ending June 2023, driven primarily by an increase in international student numbers and high demand for workers in the health and care sector
Net migration is a commonly used measure of the overall scale of migration in the UK. It takes into account not just people moving to the country, but also those leaving. This helps understand migration’s contribution to population growth—especially since many people who move to the UK do not remain here permanently. However, the net migration measure has many flaws. For example, it tells us little about who is arriving and leaving or what their impacts are. It can also produce counterintuitive or misleading figures when migration patterns change substantially in a short period, as discussed further below. The UK is unusual in its choice to use net migration in policy debates as the main measure for discussing migration levels.
Official net migration estimates are currently very uncertain and published figures will be revised. For example, in 2023 ONS revised the estimate of net migration for the year ending December 2022 upwards by 23% or 139,000. (For more detail, see the Evidence Gaps and Limitations section, below.)
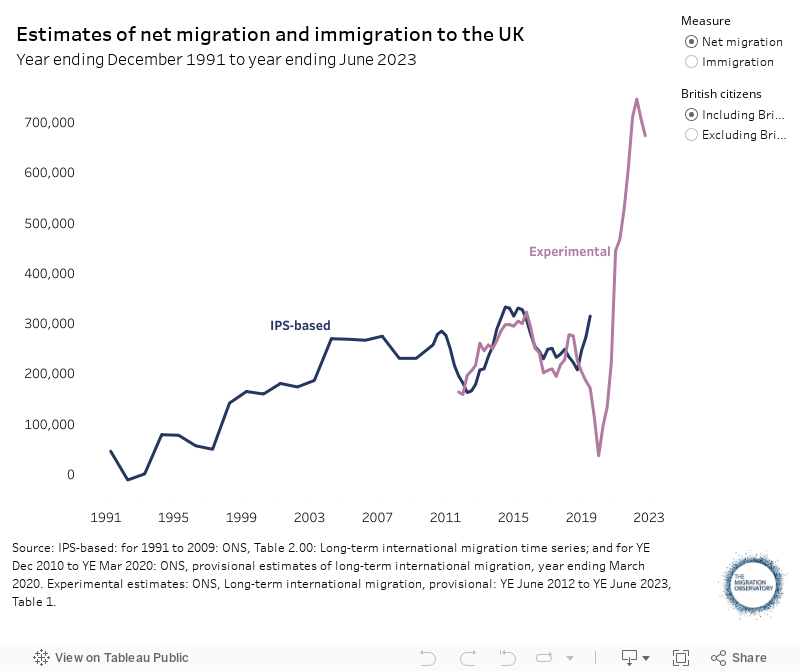
With this caveat in mind, estimates from the Office for National Statistics suggest that total net migration was 672,000 in the year ending June 2023. This was substantially above pre-pandemic estimates of between 300,000 and 400,000 (depending on which measure is used) (Figure 2).
Figure 2
The rise in overall net migration was driven by an increase in non-EU citizens coming to the UK. Non-EU net migration gradually increased during the 2010s, reaching 184,000 in 2019. It fell briefly in 2020 due to the pandemic but has since risen sharply, to 768,000 in the year ending June 2023. This was the result of a large increase in the number of non-EU migrants coming to the UK—there were 968,000 non-EU long-term arrivals in the year ending June 2023, over two and a half times more than the number recorded in 2019 (368,000) (Figure 3).
Figure 3
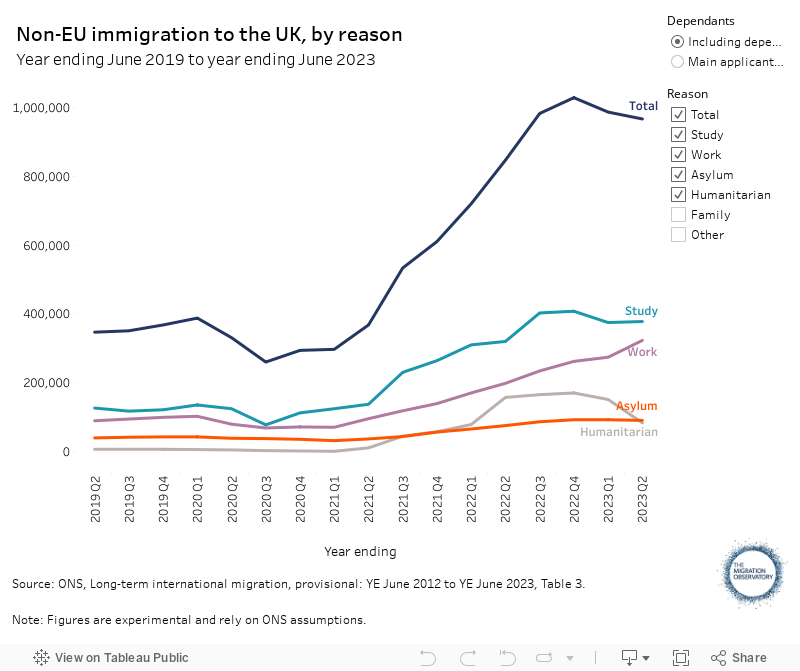
ONS estimates show three main explanations for this 600,000 increase in non-EU immigration in 2022-2023 compared to 2019 (see also Figure 3):
- International students. The largest single group explaining the rise was international students and their dependants, accounting for 43% of the increase from 2019 to the year ending June 2023. The UK has an explicit strategy of increasing and diversifying foreign student recruitment, and it is also plausible that the reintroduction of post-study work rights post-Brexit has made the UK more attractive to international students.
- Skilled workers: 37% of the increase in long-term immigration from 2019 to the year ending June 2023 resulted from those arriving for work purposes—particularly skilled workers—and their dependants. Health and care was the main industry driving the growth, including care workers who received access to the immigration system in February 2022. There has also been higher demand for some workers who were already eligible for visas under the old system, such as doctors and nurses.
- Humanitarian visa routes and refugee resettlement accounted for a further 13% of the increase in long-term international migration. This follows the introduction of visa routes for Ukrainians and Hong Kong British Nationals (Overseas) status holders, which together make up almost all of the arrivals under the ‘Humanitarian’ category in Figure 3. The number of non-EU migrants coming to the UK via humanitarian routes peaked in December 2022 and has since been in decline.
The Migration Observatory briefing note, Why has non-EU migration to the UK risen?, explains these figures in more detail, and more information on the drivers of work and student migration is available in the Migration Observatory briefings, Work visas and migrant workers in the UK and Student migration to the UK.
Rising emigration may put downward pressure on net migration from 2024 onwards
Net migration at the levels seen in 2023 cannot be assumed to be a ‘new normal’. The future outlook for immigration is necessarily uncertain. The government announced various measures designed to reduce migration, particularly by family members of international students and care workers.
Many non-EU citizens—and particularly international students—have traditionally come to the UK for periods of a few years, before emigrating again. Recent increases in study migration are thus expected to lead to temporarily estimates of net migration for at least 2-3 years, before emigration catches up. This is already reflected in student migration patterns since the pandemic—the estimated number of students emigrating in the year ending June 2023 was 80% higher than in the year ending June 2022 (115,000 compared to 64,000). For a further discussion, see the Migration Observatory report, Why are the latest net migration figures not a reliable guide to future trends?
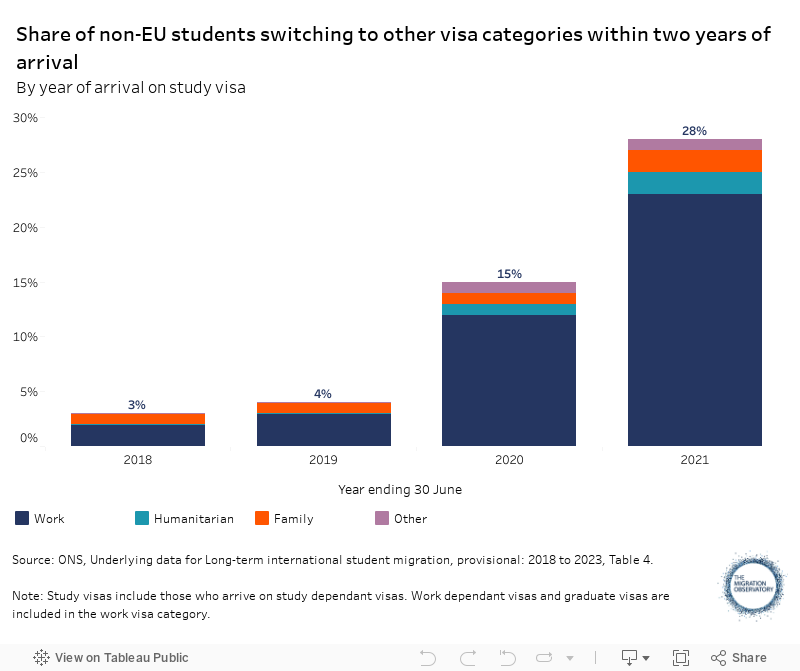
It is still reasonable to assume that a majority of international students will eventually leave the UK. Among non-EU citizens with visas granted in 2008, when the previous post-study work regime was in place, 83% saw their visas expire by the end of the seventh year after arrival. However, it is possible that migration patterns will be different (and higher) for recent cohorts, who are more likely to come from countries like Nigeria and India that have typically had higher permanent stay rates in the UK. Early evidence from ONS suggests that recent cohorts of students have been staying longer than those who preceded them, most likely due to the graduate route (Figure 4). At this stage, it is too early to say how many students will remain in the UK permanently, e.g. by switching to long-term skilled work visas.
Even if a majority of students and workers eventually leave the country, those who remain do of course contribute to net migration in the long term and not just the short term. For example, if 500,000 sponsored students arrived in a given year and 20% remained permanently, that annual cohort would contribute 100,000 to net migration over the long term.
Figure 4
Students’ temporary stays have previously generated debate about whether they should be included in net migration statistics. Net migration data are used to generate population estimates, and since students are part of the population, removing them from the UK’s main net migration figures would make population estimates less accurate. Other countries routinely include students in their net migration statistics, including Australia, Canada, the United States and New Zealand. One difference between the UK and other countries is that UK policy debates focus more on net migration (and thus are more affected by idiosyncrasies of the net migration measure), while debate in other countries tends to focus on immigration and grants of temporary or permanent status.
Net migration of EU citizens was negative in the year ending June 2023
Shortly before the 2016 referendum on EU membership, EU citizens made up the majority of all net migration to the UK (excluding British citizens). Depending on the data source used, EU citizens contributed between 59% and 77% of estimated net migration in the year ending March 2015. This high share was unusual by historical standards. It partly resulted from temporary factors: Romanian and Bulgarian citizens receiving full access to the UK labour market in 2014, and migration from Southern European countries where youth unemployment was high due to the Eurozone crisis.
Since the 2016 referendum, the picture has changed (Figure 5). Although policy towards EU citizens did not change until January 2021, EU net migration began to fall immediately after the referendum. Possible explanations for this decline include the economic recovery in southern European countries following the Eurozone crisis, the decline in the value of the pound after the referendum, which made work in the UK less attractive, and uncertainty about the political climate. The decline in the EU share also resulted from rising non-EU migration during the same period.
Figure 5
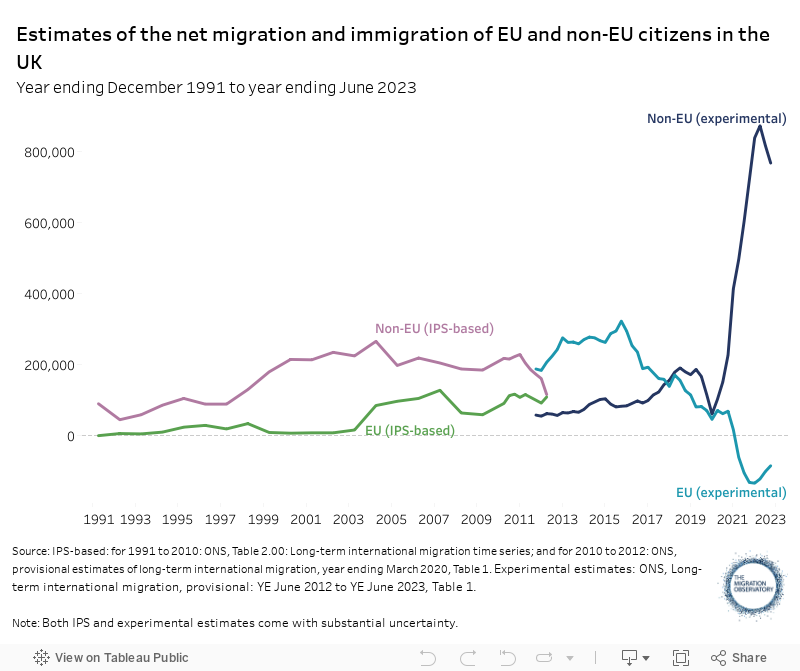
Despite earlier analysis suggesting that EU net migration was negative during the pandemic (i.e. that there was net emigration), ONS experimental estimates revised in late 2023 indicate that EU net migration remained positive in the 2020 calendar year. It estimates that emigration of EU citizens only turned negative with the introduction of the post-Brexit immigration system in 2021, which greatly reduced opportunities for EU citizens to move to the UK. Take-up of work visas among EU citizens in the post-Brexit immigration system in 2021 and 2022 was relatively low, as explained in the Migration Observatory briefing, Work visas and migrant workers in the UK.
Net migration of EU citizens in the year ending June 2023 was -86,000, according to experimental ONS estimates. More detail on how EU net migration has changed following the Brexit referendum and COVID-19 pandemic can be found in the Migration Observatory briefing EU Migration to and from the UK. The impacts of lower EU net migration in the labour market are discussed in the Migration Observatory report, How is the End of Free Movement Affecting the Low-Wage Labour Force in the UK?
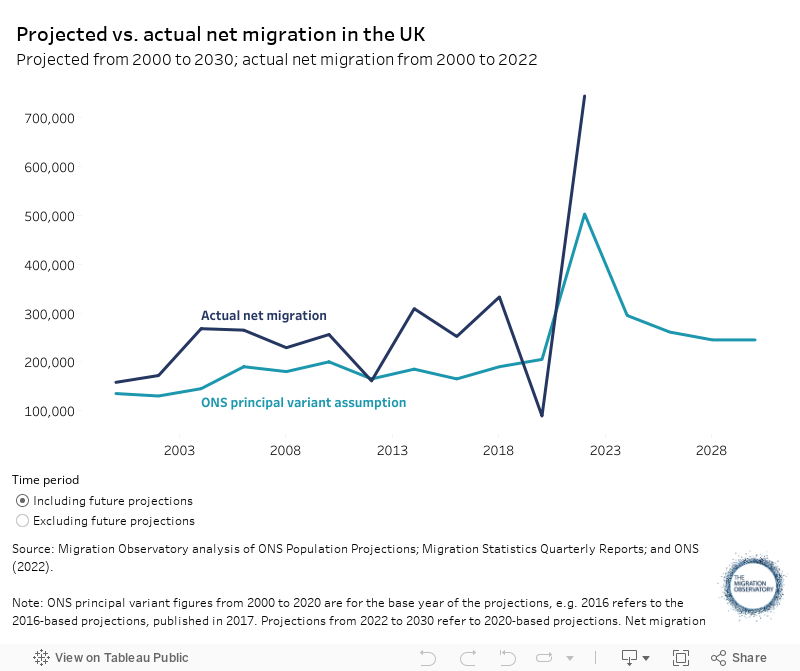
Projections of future net migration are inherently uncertain
The estimate of 745,000 net migration in the year ending December 2022 contrasts with lower projections of future net migration from ONS and the Office for Budget Responsibility (OBR).
ONS produces population projections that are used for planning services and making public finance forecasts, among other things. This requires assumptions about future net migration. Making these assumptions is difficult because migration patterns depend on so many different factors both within and beyond government policy. ONS assumptions typically have not taken into account migration policy announcements or political intentions, but instead are based on historical migration and consultations with academic experts.
In its most recent population projections, produced in early 2023 and based on 2020 data, ONS assumed that net migration would fall to an average long-term level of 245,000 by 2027. The fact that net migration in the year ending December 2022 was an estimated 745,000 does not mean that this projection is ‘wrong,’ since the projection is for long-term migration after 2027 when some of the factors that have increased net migration recently may no longer be present.
Nonetheless, net migration assumptions contained in population projections over the past twenty years have usually undershot. Figure 6 shows the ONS migration assumption used in its principal population projection compared to official estimates of net migration in the same year. In most years, actual net migration has been higher than the projection based on data for the same year, which means that the projections assumed net migration would decline in future. In practice, net migration has fluctuated up and down, but usually remained higher than projected. For example, net migration was an estimated 229,000 in 2008. The 2008-based population projections assumed that net migration would fall to 180,000 within a few years, but it remained persistently above 180,000, with a brief exception in 2012. Another exceptional year was 2020 when the COVID-19 pandemic unexpectedly reduced net migration.
Modelling of future net migration levels by the Migration Observatory and the London School of Economics suggests that the ONS central assumption may still be too low, even after increasing the central scenario to 245,000. To find out more, see the Migration Observatory report, Why are the latest net migration figures not a reliable guide to future trends?
Figure 6
Evidence Gaps and Limitations
When producing the most recent year of data, ONS also relies on assumptions about future travel patterns that are necessarily uncertain. As a result, provisional estimates are sometimes revised substantially. In particular, ONS must make assumptions about the share of people granted long-term visas who will not remain in the UK for the full duration of their visa. Still, it is likely that migration behaviours are changing following the introduction of the post-Brexit immigration system. For example, the November 2023 publication that produced migration estimates for the year ending June 2023 also provided revised estimates for previous years using more complete travel data. Due to changing mobility patterns, the estimate for the year ending December 2022 was revised up by 139,000 or 23%. ONS thus faces a trade-off between timeliness and accuracy of its provisional statistics.
The migration of British Nationals Overseas (BNO) status holders has also created statistical difficulties because some of them appear to have been counted as British Nationals in the International Passenger Survey, which is used to estimate net migration of UK citizens. People who enter the UK without permission (e.g. in small boats) are included in the statistics if they claim asylum. Still, irregular migrants who do not claim asylum will not be included.
Estimates of EU citizen migration come from the RAPID tax and benefits database, which is not designed to measure migration flows. In the most recent estimates, both immigration and emigration of EU citizens are relatively high at 129,000 and 215,000, respectively. The EU immigration estimate is much higher than the number of visas granted to EU citizens (57,000 in the year ending June 2023, excluding visitors, transit and frontier workers who do not live in the UK). ONS analysis suggests that most of the EU citizens migrating to the UK during this period were not on visas but already held status under the EU Settlement Scheme (EUSS). Full data on the migration of people with EUSS status are not currently published.
Acknowledgements
Thanks to Chris Stickney for comments on an earlier draft of this briefing. This research is supported by Trust for London. Trust for London is one of the largest independent charitable foundations in London and supports work which tackles poverty and inequality in the capital. More details at www.trustforlondon.org.uk.
References
- Migration Advisory Committee. 2018. EEA Migration in the UK: Final Report. London: MAC. Available online.
- ONS. 2023a. Methods to produce provisional long-term international migration estimates. Newport: ONS. Available online.
- ONS. 2023b. International migration research, progress update: November 2023. Newport: ONS. Available online.
- ONS. 2023c. Long-term international migration, provisional: year ending June 2023. Newport: ONS. Available online.
-
Media Coverage
-
The Guardian (25 May 2016)
Would local government be better off outside the EU? A head to head
-
The Guardian (25 May 2016)