
This briefing examines the different reasons for migration to the UK: work, study, family and humanitarian protection.
-
Key Points
- Non-EU citizens accounted for 62% of long-term immigration to the UK in 2018
More… - Work and study are the most common reasons for moving to the UK – together making up 71% of long-term immigration in 2018 – while asylum is the least common reason
More… - Following the Brexit referendum, long-term immigration to the UK for work declined, especially among EU citizens and people without a definite job lined up
More… - International study grew steadily from the late 1990s to 2018/19, driven by students from non-EU countries – China, in particular, made up one-third of all first year international students in 2018/19
More… - Family immigration has declined as a share of immigration since the 1990s and made up only 12% of long-term immigration from 2016 to 2018, although family members are more likely to settle permanently than people who come for work or study
More… - Despite an increase in grants of asylum and refugee resettlement to the UK since 2015, asylum and resettlement comprised an estimated 6% of overall long-term immigration in 2018
More…
- Non-EU citizens accounted for 62% of long-term immigration to the UK in 2018
-
Understanding the Policy
Migrants’ reasons for moving to the UK are usually classified into four main categories: work, study, family, and asylum or refugee resettlement. Until end of the post-Brexit transition period, there are different rules for EU citizens (as well as the EEA and Switzerland) and non-EU citizens... Click to read more.EU citizens are able to move to the UK for any reason without applying for permission (more detailed Migration Observatory discussion on the free movement of EU citizens is available here). Non-EU citizens must apply for permission to live or work in the UK. From January 2021, however, it is expected that all non-UK citizens, with the exception of Irish citizens, will face broadly the same immigration controls. This will make it more difficult for EU citizens to move to the UK, while certain routes will become less restrictive for non-EU citizens (Home Office, 2020). For simplicity, in this briefing we refer to policy towards ‘EU citizens’ and this should be understood to include Swiss and non-EU EEA citizens.
Work – Non-EU citizens coming for work must apply for one of a range of work visas that are available for different purposes and with different requirements, most of which are part of the UK’s ‘points-based system’. To move to the UK long-term and eventually apply for settlement, work visa holders must generally be in a job that is classified as ‘skilled’. There are few options for work-visas for people coming to take up low-wage positions, and those that do exist are usually strictly temporary (e.g., the ‘Youth Mobility Scheme’ or Seasonal Agricultural Workers Scheme). More information on work routes can be found in the Migration Observatory briefing, Work visas and migrant workers in the UK. See also Exploiting the Opportunity? Low-Skilled Work Migration after Brexit for a discussion of the policy issues related to low-wage work.
Study – Non-EU citizens who want to study in the UK must be sponsored by a licensed educational institution, meet requirements such as proficiency in English and show they have sufficient funds to maintain themselves during their studies. They also usually pay unsubsidised tuition fees. More information on international students is available in the Migration Observatory briefing, International Student Migration to the UK.
Family – Analysis often distinguishes between ‘family migrants’ who come to join a UK citizen or person with permanent settlement rights in the UK, vs. ‘dependents’ who come to accompany or join a person on a temporary visa. Non-EU family migrants coming to live with a UK citizen or settled person must meet a minimum income requirement (Migration Observatory analysis of this requirement is available here). The rules for dependents depend on the type of visa the main applicant holds; some people (e.g., those on skilled work visas) can bring their partner or children to the UK while others (e.g., those on temporary ‘youth mobility’ visas) cannot. For a more detailed discussion of family migration, see the Migration Observatory briefing, Non-EU Family Migration to the UK.
Asylum and refugee resettlement – non-UK citizens can seek asylum in the UK under the United Nations 1951 Refugee Convention. Refugee status is to be granted if the asylum-seeker has “a well-founded fear of being persecuted for reasons of race, religion, nationality, membership of a particular social group or political opinion, is outside the country of his nationality and unable or, owing to such fear, is unwilling to avail himself of the protection of that country”. Asylum in the UK can only be sought on UK soil. As there is no asylum visa, non-EU citizens who seek asylum in the UK must usually arrive a) on a visa that has been issued for another purpose, such as tourism or study, b) as a passenger in transit to a country other than the UK or as a tourist to the UK (who is not required to obtain a visa for these types of travel) or c) without permission to do so.
Unlike asylum seekers, resettled refugees are selected outside of the UK and brought here by the UK government and the United Nations. For more information, please see the Migration Observatory briefing, Migration to the UK: Asylum and Resettled Refugees.
-
Understanding the Evidence
The words ‘migrant’ and ‘immigrant’ are used differently in different contexts. Most of the data used in this briefing... Click to read more.…refer to non-UK citizens. British nationals moving to the UK are excluded from the figures in this briefing where possible. For a discussion of migration terminology and its effects, see the Migration Observatory briefing, Who Counts as a Migrant: Definitions and their Consequences.
This briefing uses the Long-Term International Migration (LTIM) estimates of the UK Office for National Statistics (ONS), which are mainly based on the International Passenger Survey (IPS), but also include adjustments from other sources, such as Home Office data on asylum seekers. IPS immigration data are based on respondents’ stated intention that they are moving to the UK for at least one year.
There is uncertainty about the accuracy of some of the components of the LTIM and IPS estimates (Office for National Statistics, 2019a). Fluctuations in IPS figures – which have significant margins of error – are not always visible in other data sources such as visa issuances. ONS has frequently said that it believes the IPS – which is commonly used in policy debates to scrutinise specific subcategories of migration such as non-EU students or EU workers – has been “stretched beyond its original purpose” (Office for National Statistics, 2019a). It has also cautioned against reading too much into year-on-year variations in specific components, because relatively high sampling errors mean that short-term changes in these small-group estimates may represent statistical noise rather than a real trend.
The LTIM figures have been revised on several occasions, most recently in August 2019, following improvements to the ONS methodology. These recent revisions affected immigration from EU8 countries, while other EU immigration has not yet been revised and so may not be directly comparable.
This briefing also uses Home Office data on a) visas issued to non-EU citizens for work, study, family and b) protection granted to asylum-seekers and refugees. Not everybody who is issued a visa will necessarily come to the UK – some may change their plans after a visa is issued. The type of visa may also not align with the motivations of the individual or their activities while in the UK – those on student visas, for example, are permitted to work a specified number of hours.
Home Office asylum data face practical limitations when it comes to understanding the immigration of forced migrants. While the Home Office provides figures on the total asylum claims lodged in a given year, some of these claims are made by those who were already living in the UK and there are no data on the duration of residence before the claim was made. We cannot assume that asylum applications represent ‘arrivals’ of individuals in a given year. Nor do we know the duration of asylum-seekers’ stay in the UK. For more detailed analysis and discussion of these data, see the Migration Observatory briefing, Migration to the UK: Asylum and Resettled Refugees.
Finally, this briefing uses data from the Higher Education Statistics Agency (HESA) on international students. These data classify students by domicile (rather than country of birth or nationality). Domicile is defined as the place of ‘normal residence’ before taking up study, which means that some UK citizens who have been living abroad before coming back to the UK to study will be counted as international students in the HESA data. Nonetheless, HESA provides the most detailed and reliable information about international students in higher education in the UK.
This briefing follows the Home Office country groupings, which are explained here.
Non-EU citizens accounted for 62% of long-term immigration to the UK in 2018
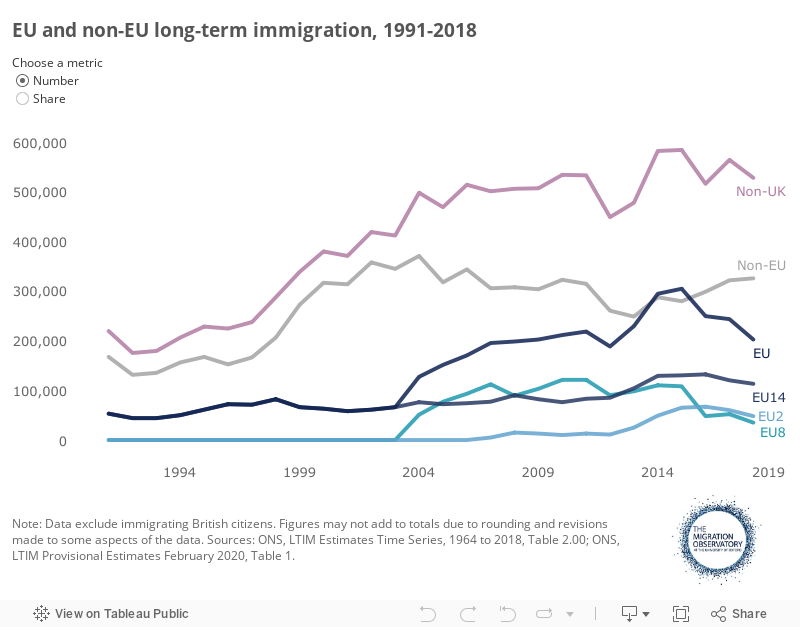
In 2018, an estimated 527,000 foreign citizens arrived in the UK with the intention of staying for at least one year. Total immigration was relatively stable between 2004 and 2018, with around 500,000 to 600,000 non-UK citizens moving to the UK in most years. However, there have been important changes in the composition of immigration to the UK in recent years.
Traditionally, most immigration to the UK has been from outside of the EU, and this remains the case today. Non-EU citizens accounted for an estimated 62% of all long-term immigrants who arrived in 2018. Official estimates, last revised in February 2020, suggest that they outnumbered EU immigrants every year between 1991 and 2018, except for 2014 and 2015.
The 2004 EU expansion set the stage for a sustained rise in annual immigration to the UK, driven primarily by EU citizens. From 1991 to 2003, an estimated 22% of immigrants who moved to the UK for at least a year were from EU countries, compared to 41% between 2004 and 2018.
Non-EU immigration has been more stable than EU immigration, especially since 2004. This is in part because free movement rules allowed EU migration to be more responsive to changes in the external environment, such as the economic downturn in the UK in 2008, the Eurozone crisis in countries of origin, and the EU referendum. After the referendum, EU immigration – and in particular EU8 immigration – fell sharply while non-EU immigration increased steadily.
While non-EU migration did fall following new restrictions on work, study and family immigration rules from 2010-2012, these declines had been reversed by 2018, primarily as a result of growing work and study-related migration from non-EU countries. This included more non-EU workers in the health sector in particular, as well as more students in response to the growing demand for international study.
It remains to be seen how the UK’s departure from the EU and the end of freedom of movement—not to mention the 2020 coronavirus crisis—will affect the level and composition of migration to the UK in the long-term. This is because immigration levels and the impacts of policy on them are both notoriously difficult to predict (Bijak et al, 2015) and are themselves affected by broader social and economic changes in the UK and elsewhere.
Figure 1
The share and composition of immigrants are not uniform across the UK. In 2018, for example, London made up 13% of the UK’s population but received closer to 30% of all non-British immigrants (ONS, IPS Table 4.04 and 2018 Mid-Year Population Estimates, Table MYE2). In the same year, 40% of immigrants who moved to England and 30% who moved to Scotland were EU citizens, compared to 7% in Wales. For more information on the distribution of immigrants across the UK, see the Migration Observatory briefing, Where do migrants live in the UK?
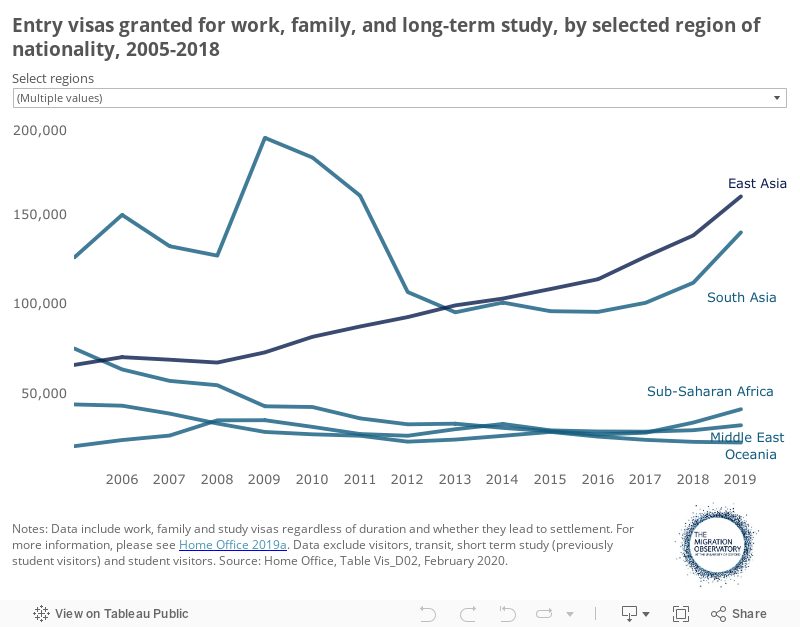
Citizens of Asian countries received 58% of entry visas issued for work, family or study over the period 2005 to 2019 and 65% in 2019. The annual share of citizens from East Asia increased from 13% (66,000) of all work, family or study visas issued in 2005 to 30% (160,000) in 2019. This is mainly due to an increase in long-term study visas, a large share of which go to Chinese citizens. The decrease in visas granted to citizens of South Asian countries from 2010-2012 was driven primarily by a decline in student visas, particularly in further education colleges following policy changes restricting their ability to sponsor international students.
Figure 2
Work and study made up 71% of long-term immigration in 2018
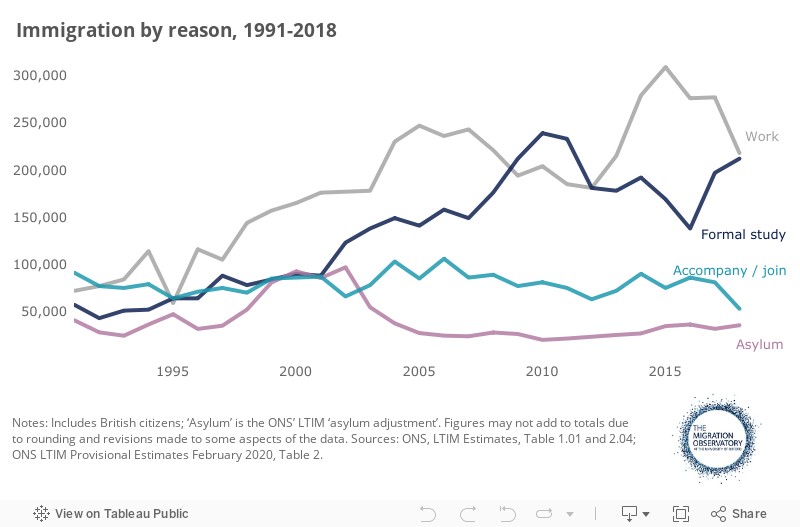
In 2018, the main reasons that migrants gave for moving to the UK for at least a year were work (217,000) and formal study (211,000) (ONS LTIM Provisional Estimates June 2019, Table 2). (These data are ONS estimates of main reasons for immigration, which include a small number of British citizens immigrating to the UK.)
Work has traditionally been the main reason cited for moving to the UK, especially among EU migrants. It accounted for 38% of all long-term immigration between 2000 and 2018. During the financial crisis, labour migration decreased and immigration was increasingly driven by arrivals of international students. In 2013, however, work re-emerged as the most common reason for coming to the UK.
Following the 2016 referendum result, work-related immigration decreased due to a decline in EU immigration. In 2018, the scale of work and study immigration to the UK was about the same. In the year ending September 2019, the estimated number of international students moving to the UK outstripped workers, although, taking into account the margins of error that accompany the data, this is not a statistically significant change from the previous year.
Immigration to accompany or join a family member has not kept pace with other types of immigration and its share of total inflows steadily decreased to three-year averages of between 12% and 13% over the period 2009-2018, the lowest on record. Except for during the early 2000s, asylum has been the least common reason for migrating to the UK, comprising about 5% of estimated annual arrivals between 2004 and 2018.
Figure 3
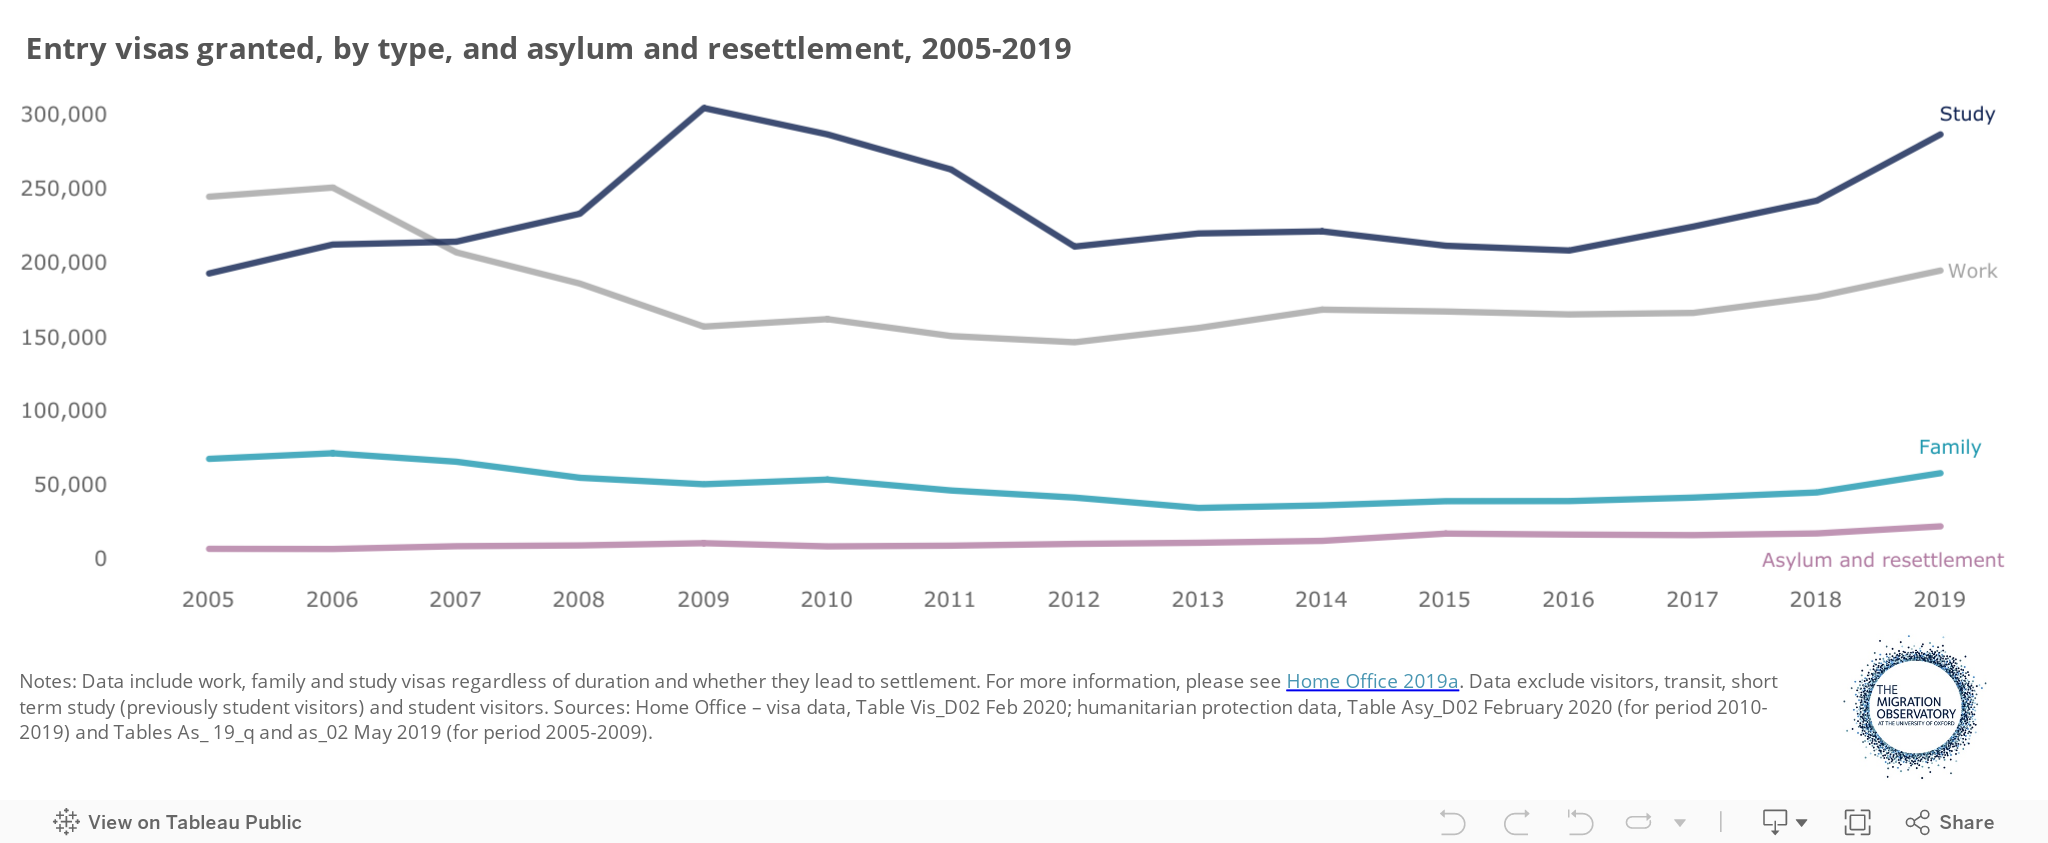
Home Office data on the types of entry visas issued show that study was the most common type of visa issued to non-EU citizens between 2005 and 2019. It made up 46% (286,000) of entry visas granted in 2019, followed by work (31%, 194,000) and family (9%, 57,000).
Figure 4
In 2019, citizens of China received 21% of visas – more than any other nation – with roughly 91% (120,000) of the 130,000 visas granted for study and 5% (6,500) for work. Among Indians, the next most common citizenship in 2019 with 118,000 visas granted overall, the situation was the opposite: the majority of visas were granted for work (55%, 65,000) rather than study (32%, 38,000). The United States was the third most common country of citizenship among visa recipients in 2019, with 33,000 visas; 45% (15,000) were for study and 41% (14,000) were for work.
Following the Brexit referendum, immigration to the UK for long-term work declined
In 2018, an estimated 217,000 people (including a small number of British citizens) moved to the UK to work, making up 36% of people moving for at least a year. This was down by nearly one-third from 2015’s record high of 308,000 (46%).
This recent decline in work-related migration was driven by fewer EU citizens moving to the UK, who are more likely than non-EU citizens to move to the UK for work. Between 2007 and 2018, the majority of migrants who moved to the UK for work were EU citizens. This is a departure from the mid-1990s to the mid-2000s, when most people who immigrated to the UK for work were citizens of non-EU countries. The shift in work-related immigration away non-EU citizens towards EU citizens follows EU expansion and the Eurozone crisis (which increased the UK’s attractiveness to people from EU countries).
Figure 5
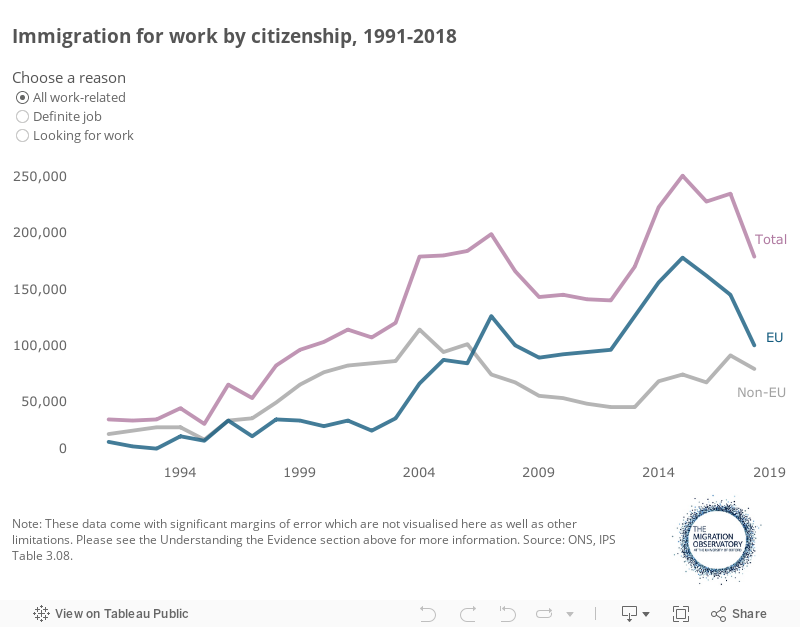
Migrants moving to the UK with a definite job consistently outnumber those who arrive in search of work. Roughly two-thirds of all migrants who moved to the UK for work between 2013 and 2018 came with a definite job (ONS LTIM Provisional Estimates February 2020, Table 2). Between 2004 and 2018, 61% of migrants who moved to the UK to work were EU citizens and were more likely than their non-EU counterparts to come looking for a job (ONS, IPS Table 3.08).
For more detailed analysis of migrant workers in the UK, see the Migration Observatory briefings, Migrants in the UK Labour Market: An Overview and Work visas and migrant workers in the UK. Local level data on the employment rates of UK’s foreign-born population can be found in the Migration Observatory Local Data Guide.
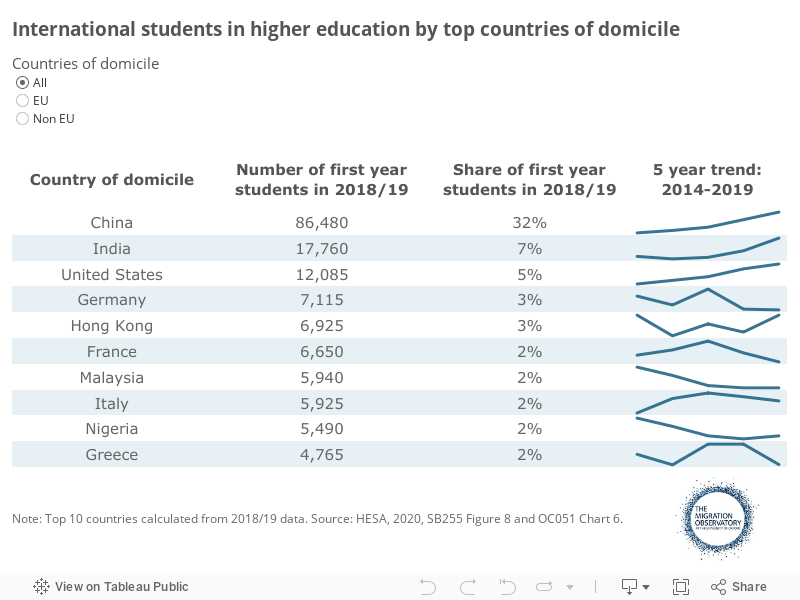
Student migration grew steadily from the late 1990s to 2018/19
In 2018, an estimated 211,000 students moved to the UK long-term for formal study, the highest figure since 2011 (ONS, LTIM Provisional Estimates February 2020, Table 2). Provisional estimates for the year ending September 2019 put study above work as the main reason given for moving to the UK, although, due to the uncertainty surrounding these estimates, the difference was not statistically significant.
In the academic year 2018/19, roughly three-quarters (204,000) of the 267,000 international students in their first year of UK higher education were from non-EU countries, according to Higher Education Statistics Agency (HESA) data. Increasingly, this means China. From 2006/07 to 2018/19, the number of first-year higher education students from China more than tripled from 25,000 to 86,000 and it overtook all EU countries combined as the main area of domicile in 2012/13. Meanwhile, the number and share of first year EU students in higher education was broadly flat at about 61,000 per year, or between one-quarter and one-third of all first year international students.
Between 2014/15 and 2018/19, the top three countries of domicile of international students in their first year of study were outside of the EU: China, India and the United States. In 2018/19, one-third (86,000) of all international students studying in the UK came from China – up from one-quarter in 2014/15 and one-seventh in 2006/07 – followed by India (7%, 18,000) and the United States (5%, 12,000).
Figure 6
Note that study does not provide a route to long-term settlement. The majority of non-EU students are required to leave the UK after their studies have concluded (see the Migration Observatory briefing, Non-European Student Migration to the UK) and, of those, the very large majority do (Home Office, 2017). Non-EU students who want to remain in the UK permanently must usually apply for another kind of permission first (e.g., as a worker or family member).
The Migration Observatory briefing, Non-European Student Migration to the UK provides more detailed analysis and explanation of the available data on non-EU international students. Local level student data are presented in the Migration Observatory Local Data Guide.
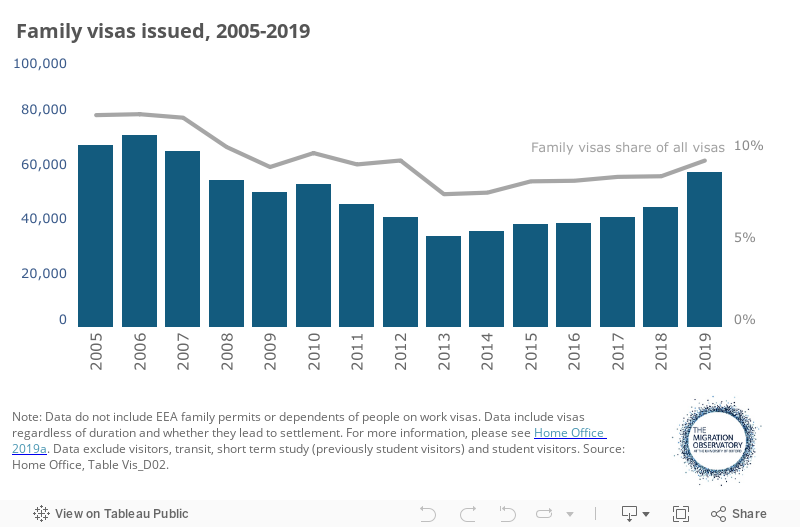
Family makes up a small share of overall immigration
An estimated 12% (72,000 per year, on average) of those who moved to the UK between 2016 and 2018 reported they came to join or accompany family, the lowest share of total immigration on record (equally as low only in 2011–2013, 2013–2015 and 2015–2017) (ONS, LTIM Provisional Estimates February 2020, Table 2). In part, this is due to family immigration not having kept pace with other types of migration, which rose substantially after the 1990s. There is some uncertainty around the data on family migration, however, as Home Office and ONS data do not tell the same story (ONS, 2019a).
Government decisions in 2010 and 2012 to impose language and income requirements on non-EU citizens applying to join or accompany family made the family route more restrictive (Home Office, 2011; Sumption and Vargas-Silva, 2019). The number of non-EU family visas fell from the late-2000s onwards, contracting by 37% between 2010 and 2013, but had recovered by 2019 (Home Office, Table Vis_D02). Between 2018 and 2019, the number of family visas issued increased by 30%, driven primarily by grants to partners of either British citizens or non-British citizens who have settled in the UK.
Figure 7
Family members are more likely to settle permanently in the UK than people who come for work or study. Among people granted an initial visa to come to the UK in 2013, for example, 85% of family visa holders still had valid leave to remain five years later at the end of 2018, compared to 23% of work visa recipients and 16% of those who had been granted study visas (Walsh, 2019). For more information on settlement, see the Migration Observatory briefing, Settlement in the UK. This is one reason why, in 2018, 44% of the foreign-born population living in the UK said that they came for family reasons (ONS, 2019b).
For more discussion of the impact of the family income requirement, see the Migration Observatory commentary, The Minimum Income Requirement for Non-EEA Family Members in the UK. For more a detailed analysis of family immigration, see the Migration Observatory briefing, Non-EU Family Migration to the UK.
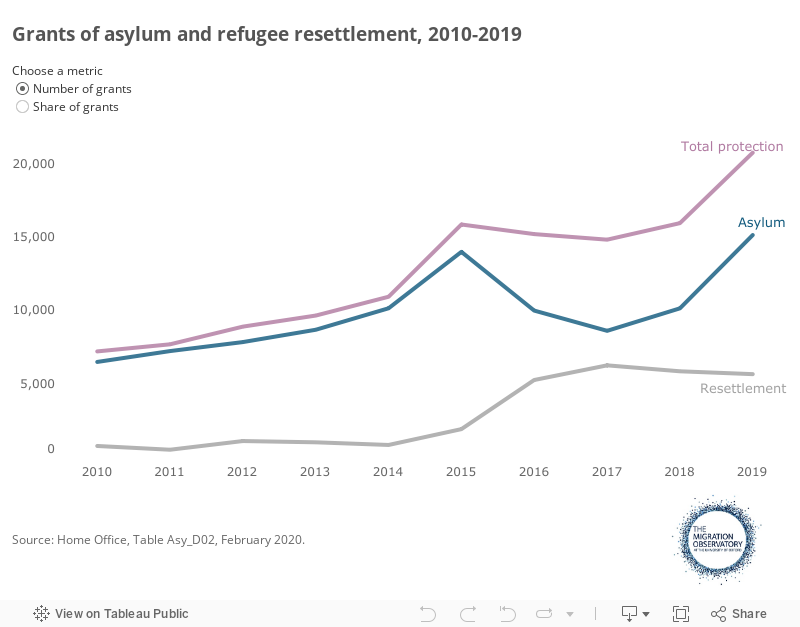
Asylum and resettlement comprised an estimated 6% of overall long-term immigration in 2018
In 2019, roughly 21,000 people (including dependants) were granted asylum, an alternative form of protection or were resettled as refugees in the UK, nearly three times the 2010 figure of 7,000 (Home Office, Table Asy_DO2). This follows increases in the numbers of forced migrants globally and in Europe, as well as government commitments to resettle more refugees from 2015 onwards.
From 2010 to 2014, between 500 and 1,000 refugees were resettled in the UK per year (9% of all types of protection granted), compared to over 5,200 every year between 2016 and 2019 (34%). Since 2016, nearly eight in every ten refugees resettled in the UK were Syrian.
Despite a marked increase in resettlement, however, grants of protection continue to make up a small share of overall immigration – an estimated 5% between 2004 and 2018 and 6% in 2018 alone (ONS, LTIM Provisional Estimates February 2020, Table 2 and LTIM Estimates, Table 1.01).
Figure 8
The share and number of children granted asylum or resettled as refugees has increased since the targeted resettlement programmes have come into effect. Between 2010 and 2014, 29% were children – roughly 2,600 per year (Home Office, Table Asy_D02). This increased to 36% (about 5,900 per year) between 2015 and 2019. More women and girls were offered some form of protection but their share remained relatively stable at about 40% of annual grants of asylum and refugees resettled since 2010.
For more detailed analysis and discussion of asylum and refugee resettlement, see the Migration Observatory Briefing, Migration to the UK: Asylum and Resettled Refugees and the House of Commons Library briefing on Asylum statistics (Sturge, 2019). Local level data on asylum seekers and resettled refugees in the UK are available in the Migration Observatory Local Data Guide.
Data gaps and limitations
Different data sources on migrants coming to the UK for different reasons or on different visa types can be difficult to compare because they are collected in different ways and often measure different things.
The most striking differences are found when comparing estimates derived from the IPS with administrative data, such as the number of visas or grants of asylum issued. There are several reasons for this:
- Different purposes. The main purpose of the IPS is to produce official statistics about international migration. Administrative data are produced primarily to support the practical functions of government and other bodies, such as universities. They are counts of administrative acts, such as records of Home Office decisions on visa applications, rather than estimates of international migration or migrants.
- Different definitions. The IPS uses the UN definition of a long-term international migrant by only counting those who say they intend on staying in the UK for at least 12 months. Administrative data reflect the administrative processes they support, which are not aligned or concerned with the UN definition. For example, because EU citizens do not need to apply for visas, they are not captured in the visa data. The figures also combine visas valid for more and less than 12 months. There is no reliable way to separate these out based on published data. Furthermore, the length of time a visa is valid does not necessarily correspond to the length of time the holder of the visa stays in the UK.
- Intentions versus reality. The IPS asks entrants to the UK how long they plan on staying. Although their plans may change, the data do not. Furthermore, their responses may not be accurate. Similarly, not everyone who applies for and is issued a visa will move to the UK and among those who do, the visa they hold may not accurately reflect the amount of time they intend on spending in the UK or what they plan on doing while they are here.
- Other quality issues. The more difficult it is to capture a population group and the shorter the time period in question, the more uncertain the IPS estimate will be. In practical terms, this means the IPS cannot estimate smaller population groups or annual changes with great certainty. Administrative sources, on the other hand, are counts, which are more accurate and reliable, especially when looking at small groups or short time periods, but it is important (and often difficult) to bear in mind what is being counted.
There is no perfect source of data on migration to the UK. It is therefore important to consider several sources, along with their strengths and limitations. Major inconsistencies between sources should be observed. For example, the IPS data used in this briefing showed a significant decrease in family migration in 2018, which was not reflected in the Home Office’s visa data. Due to the potential unreliability of IPS data in any given year, we chose to report on a three-year average, which brought the trend more in line with the visa data.
The Office of National Statistics is currently changing the way it produces migration statistics by making more effective use of administrative sources (ONS, 2020). This means there could be substantial changes to the data in coming years, which presents its own set of challenges. It is also likely that there will be disruptions to migration data in 2020 due to the coronavirus crisis, disrupting face-to-face ONS surveys.
This briefing focuses on people who have been granted permission to live in the UK. There is very little information about the nature and scale of irregular migration in the UK, due to the difficulty measuring this phenomenon accurately.
Acknowledgements
With special thanks to Marley Morris for his valuable feedback on an earlier draft of this briefing. Research for this briefing was funded by Research England’s Strategic Priorities Fund (SPF) QR allocation.
References
- Bijak, J., G. Disney and A. Wiśniowski. 2015. How to forecast international migration. Ed. T. McGowan. ESRC Centre for Population Change, Briefing 28, University of Southampton.
- HESA. 2019. Where do HE students come from?
- Home Office. 2019a. User Guide to Home Office Immigration Statistics.
- Home Office. 2019b. Family Migration: A Consultation.
- Home Office. 2017. Second report on statistics being collected under the exit checks programme.
- Home Office. 2010. Overseas Students in the Immigration System: Types of Institution and Levels of Study. UK Border Agency, Home Office, London.
- Office of National Statistics. 2019a. Understanding different migration data sources: August 2019 progress report.
- Office of National Statistics. 2019b. Population of the UK by country of birth and nationality.
- Office of National Statistics. February 2020. Transformation of the population and migration statistics system: overview.
- Sturge, G. 2019. Asylum statistics. London, UK: House of Commons Library.
- Sumption, M. and Vargas-Silva, C. 2016. The Minimum Income Requirement for Non-EEA Family Members in the UK. Migration Observatory, Oxford.
- UK Government. 2015. Asylum Policy Instruction: EU/EEA Asylum Claims, version 3.0.