
This briefing looks at the distribution of migrants across UK nations, regions and local authorities within the UK, providing data by country of birth, nationality and reason for migration (i.e. work, study, family and asylum).
-
Key Points
- London is the most popular destination in the UK, particularly for non-EU migrants.
More… - Out of all areas in the UK, London appears to have experienced the greatest decline in both its workforce and foreign-born population during the pandemic.
More… - Non-EU migrants outnumber EU migrants in most UK nations, regions and local authorities.
More… - Non-EU born migrants are more likely than EU-born migrants to live in London, and less likely to live in the East, the South West and Scotland.
More… - Migrants in London are less likely to have come for family and more likely to have come for work or asylum than migrants in other parts of the UK.
More… - Asylum seekers awaiting a decision on their application make up a higher share of the population in the north of England, the West Midlands and Wales, and a lower share in the South East, East of England and South West.
More…
- London is the most popular destination in the UK, particularly for non-EU migrants.
-
Understanding the Evidence
Most of the analysis in this briefing uses data from the UK’s Labour Force Survey (LFS) and related Annual Population Survey (APS). The LFS, which is conducted by the UK Office for National Statistics (ONS), is the largest household survey in the UK and is designed to be representative of the population. ... Click to read more.The survey does not capture those who do not live in private households, such as in hotels, caravan parks and other communal establishments. The LFS/APS have some important limitations. Some people are excluded, such as residents of communal establishments like hostels, and other groups may be undercounted due to survey non-response. There is particular uncertainty about the reliability of the estimates for 2020 during the Covid-19 pandemic and 2020 figures should not be compared with previous years.
The Office for National Statistics (ONS) and the Migration Observatory have also published several pieces discussing the effects of the pandemic on the LFS/APS data collection and the reliability of the population estimates derived from those surveys (e.g. Athow, 2021; Sumption, 2021).
Except where otherwise stated, migrants are defined as people born outside the UK in this briefing, including those living in Northern Ireland who were born in the Republic of Ireland. This definition may differ from those used in other studies (see the Migration Observatory briefing, Who counts as a migrant?). Since 2010, the LFS asks foreign-born respondents about the reason why they came to the UK. Respondents may choose from several options including employment, family re-unification, study, and asylum. These categories are self-reported and may not be the same as the visa type under which the individual entered the country or their current visa status. The analysis on reason for migration excludes Northern Ireland and local authorities because of the small sample size. Data for Northern Ireland are unavailable at the local authority level.
The analysis also uses data from ONS’ Long-Term International Migration (LTIM) Estimates until 2019. These estimates are primarily derived from the International Passenger Survey (IPS), but also incorporate information from other sources. Due to Covid-19, however, the IPS was suspended on 16 March 2020 and, when it was re-introduced in January 2021, it no longer included a migrant sample boost. Instead, ONS plans to use administrative data to produce migration statistics as part of their population and migration statistics system transformation journey. However, these data are not yet regularly published. ONS uses the UN standard definition of a long-term international migrant – a person moving to another country for at least one year – to produce its estimates of long-term immigration.
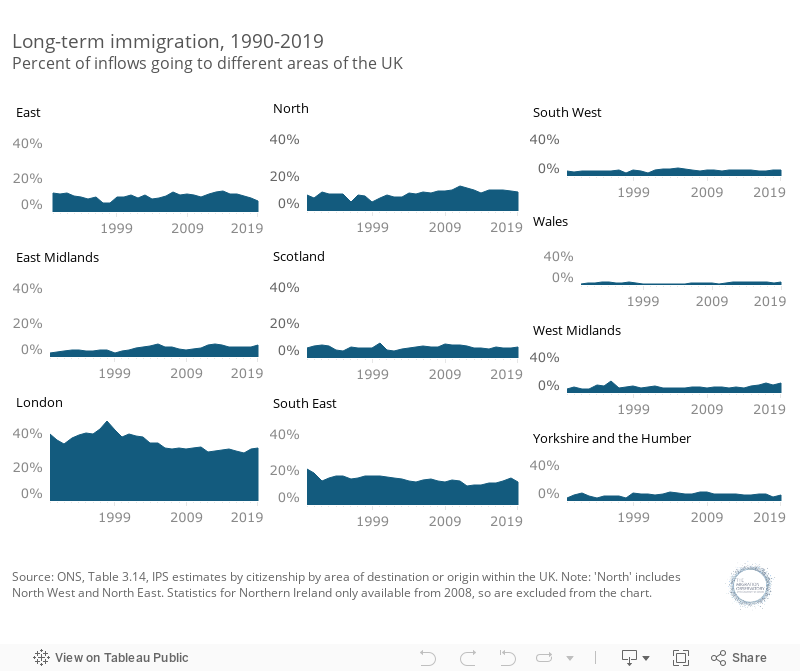
London is the most popular destination in the UK, particularly for non-EU migrants
Figure 1 presents the destination of long-term non-UK citizens who immigrated to the UK from 1990 to 2019 (before the suspension of the International Passenger Survey (IPS) in March 2020). For most of the past 20 years, London received roughly 30% of all migrants coming to the UK. The share of those who report the capital as their region of destination peaked at 46% in 1998 and has declined since then.
Figure 1
The most recent available data show that, from mid-2019 to mid-2020, the local authorities estimated to have the largest inflows of international migrants were City of London (13%), Westminster (8%) and Camden (7%), followed by Oxford and Cambridge (each 5%) (ONS, 2021). In absolute numbers, Westminster received the most international migrants over this period (21,300) followed by Camden (20,000) and Birmingham (17,400). For more local-level migration data see the Migration Observatory Local Data Guide.
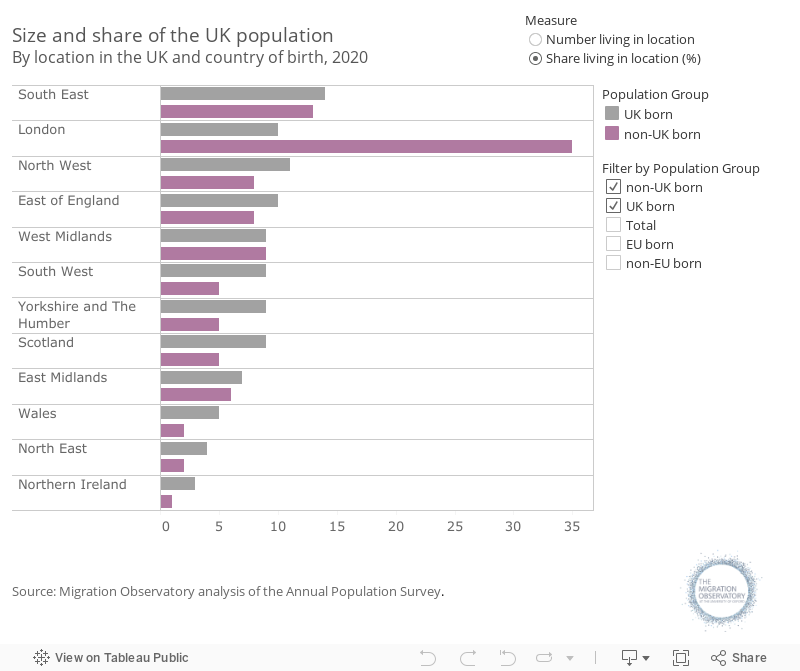
These patterns are reflected in the distribution of the foreign-born resident population across the UK, for which the data are more up to date. Although London made up only 14% of the total UK population in 2020, it was home to 35% (3.3 million) of the UK’s foreign-born population (Figure 2). This represented more than 2.5 times as many foreign-born residents as in the South East, a region with about the same total population as London. Migrants born in non-EU countries were particularly likely to live in London – amounting to 2.3 million people, or 39% of all non-EU born migrants living in the UK in 2020.
Although Northern Ireland has the smallest total and foreign-born populations in the UK, it has a larger EU-born population than the North East. This includes people born in the Republic of Ireland, which the ONS estimates comprised about 40% (36,000) of Northern Ireland’s EU-born population in 2020 (ONS, 2020).
Figure 2
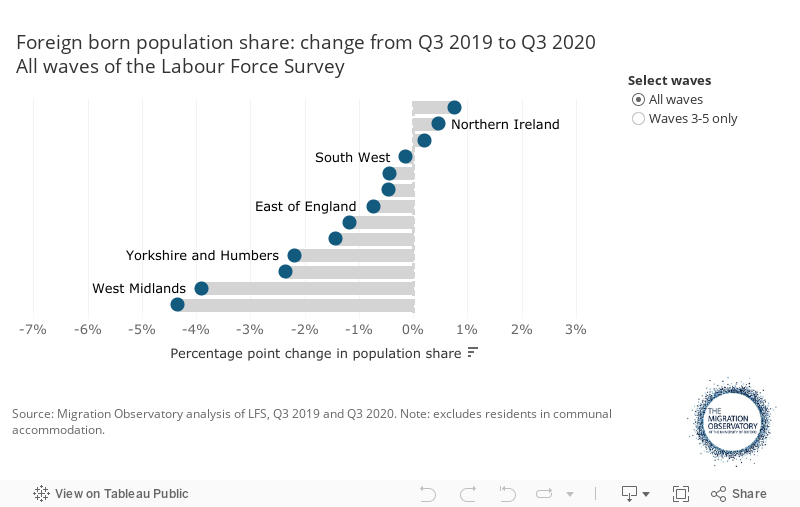
London appears to have experienced the biggest decline in its foreign-born population and workforce during the pandemic
There is significant uncertainty about what happened to migration as a result of Covid-19 (see the Understanding the Evidence section above for more detail), but London appears to be the most affected part of the UK. While the data for 2020 onwards remain uncertain, figures suggest a decline in London’s foreign-born population of 4.3% between Q3 2019 and Q3 2020, compared to the UK average of 1.4% (Figure 3). For more information see the Migration Observatory commentary, Where did all the migrants go?
Figure 3
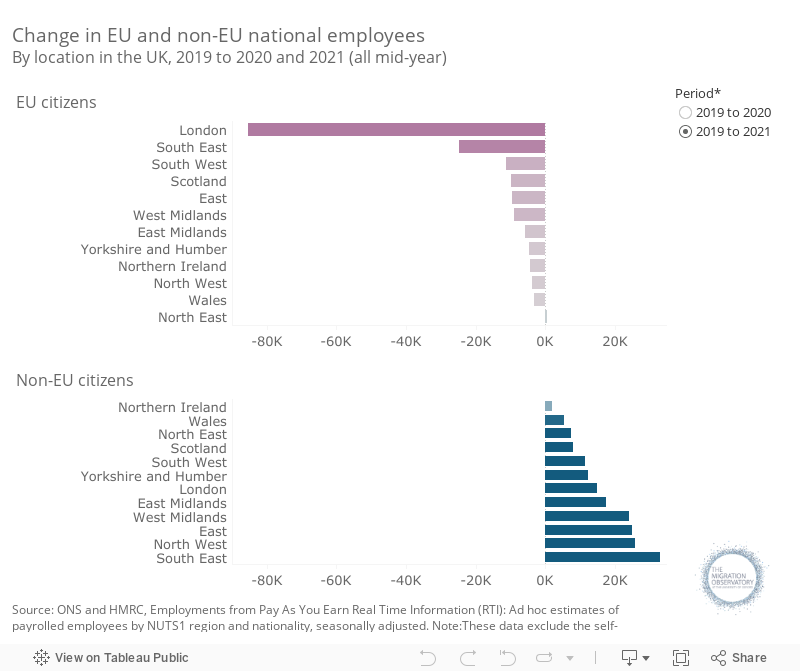
The number of EU national employees declined during the pandemic across the UK. Between mid-2019 and mid-2021, HMRC tax records show there were fewer EU national workers in all areas of the UK except for the North East (+400, or 1% of its EU workforce), with London experiencing the most significant decline (-85,400, 10%), followed by the South East (-24,800, 7%).
Despite this, by mid-2021, the UK’s foreign national workforce had recovered to pre-pandemic levels. This is due to growth in the number of non-EU national workers in all areas of the UK throughout the pandemic, but primarily since mid-2020. Between mid-2019 and mid-2021, the South East saw the largest total increase in its non-EU workforce (33,000, or 11%). Although the non-EU workforce is much smaller in the North East, it experienced the largest relative increase over the same period, jumping by 25%. These figures reflect both job losses and people moving (internationally or within the UK), and cannot distinguish between them.
Figure 4
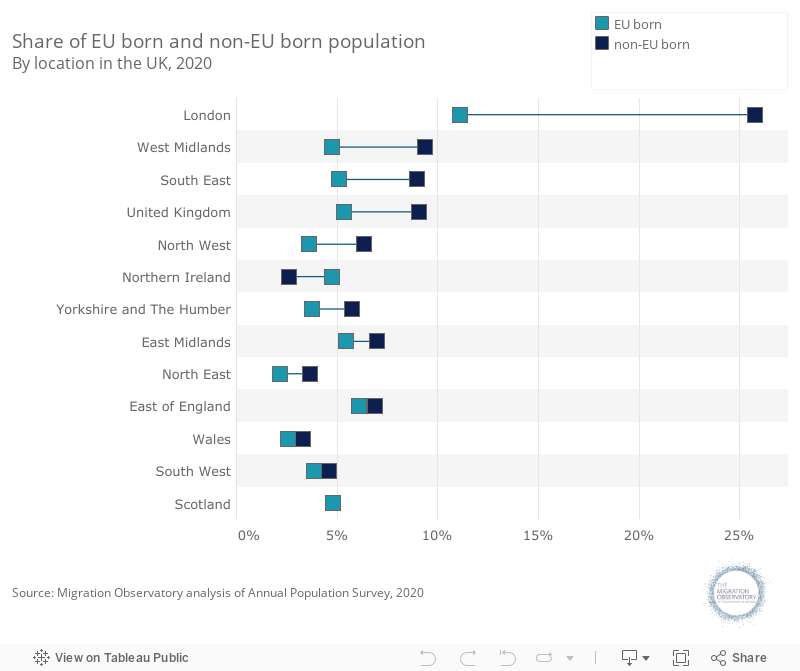
Non-EU migrants outnumber EU migrants in most parts of the UK
Migrants born in non-EU countries outnumber EU migrants across all regions, with the exception of Northern Ireland, where there are more EU migrants, and Scotland where the number of EU and non-EU born migrants is the same. In London, for example, non-EU migrants comprised an estimated 26% of the total population in 2020, while EU migrants made up 11% (Figure 5).
Figure 5
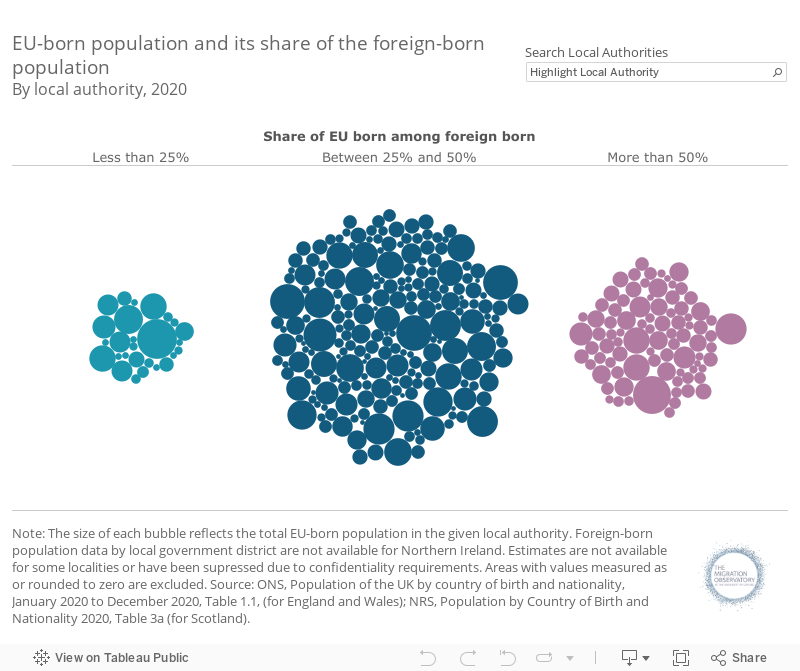
In most local authorities (LAs), the EU-born population accounted for less than half of the foreign-born population in 2020, including in all but one of London’s boroughs (Waltham Forest) (Figure 6). Where data were sufficiently robust to report, the EU-born population made up the majority of the foreign-born population in 86 of the 325 LAs (26%), including 13 out of 29 Scottish LAs (45%).
Figure 6
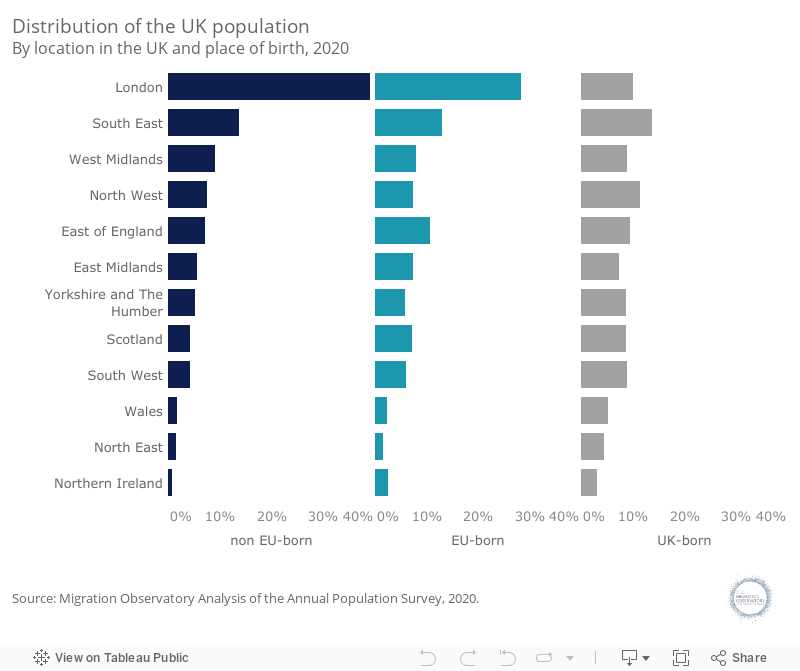
Non-EU migrants are more likely than EU migrants to live in London, while EU migrants are more likely than non-EU migrants to live in the East, the South West and Scotland
In 2020, 39% of non-EU migrants living in the UK resided in London, while 28% of EU migrants did so, which is broadly similar to past years (Figure 7). Meanwhile, EU-born migrants are more likely to live in the East of England, Scotland and the South West and Scotland. Differences in the concentrations of the two groups in other parts of the country are relatively small.
Figure 7
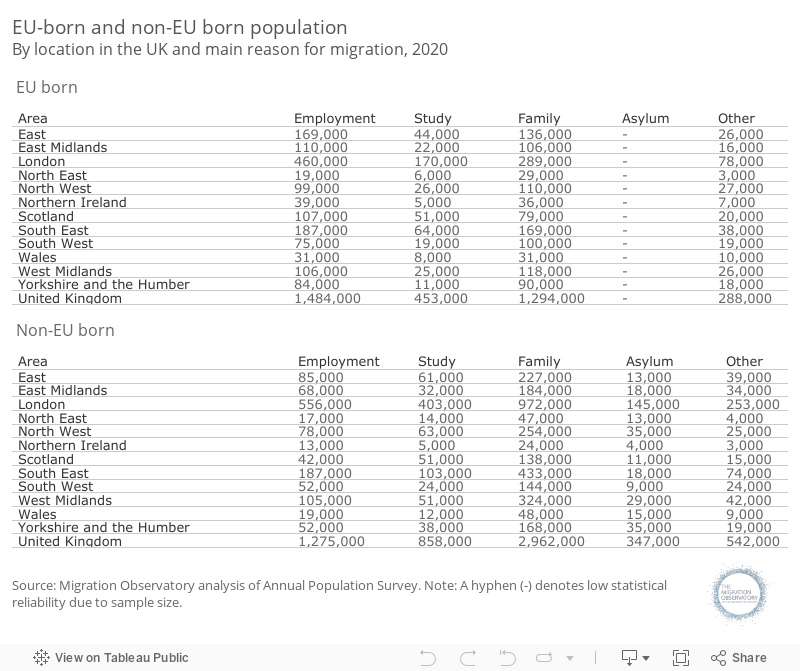
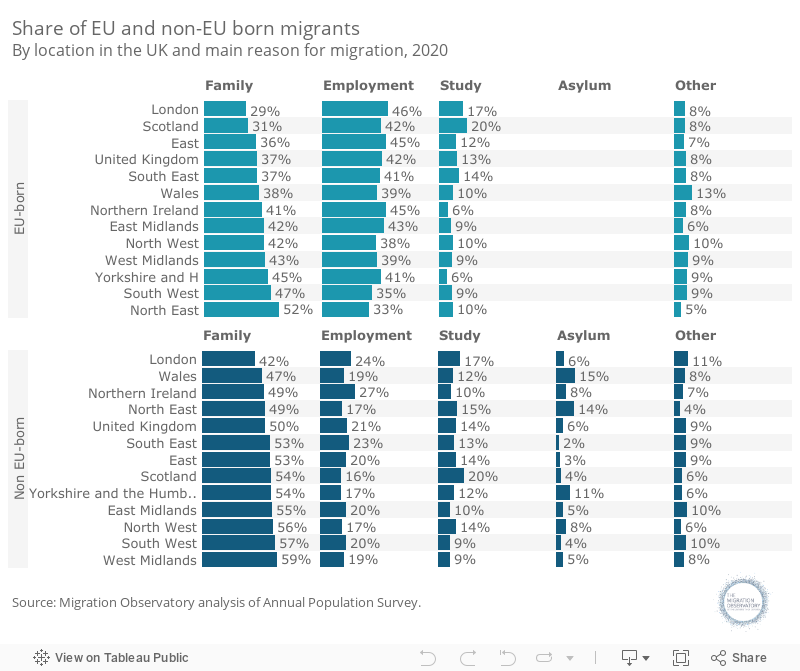
The reasons migrants came to the UK do not vary greatly across the nations and regions
The reasons for having come to the UK is relatively stable across the different nations and regions (Table 1). EU migrants in 2020 were most likely to have come for work, followed by family and study; non-EU migrants typically had come to the UK for family reasons, followed by work, study and asylum.
Migrants in London were less likely to have come for family reasons and more likely to have come for work or asylum than in other parts of the UK.
Table 1
Family migrants made up half of the UK’s population of non-EU born migrants, although the share is higher in the West Midlands, South West and North West and lower in London (Figure 8). In 2020, only 6% of non-EU migrants came to the UK to seek asylum, although there was variation across the UK.
Figure 8
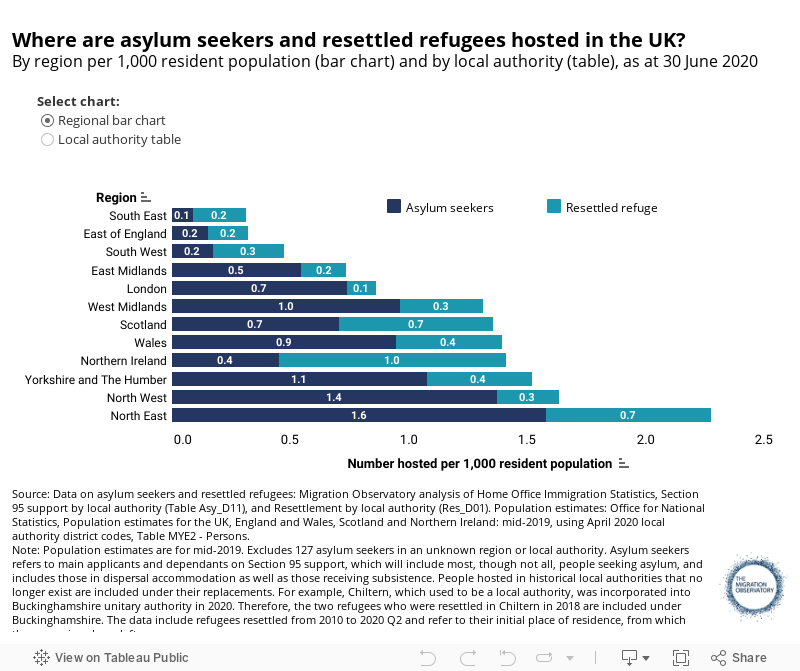
Asylum seekers are unevenly distributed across the UK
The distribution of asylum-seekers and resettled refugees across the UK is not the same as other types of migrants (Figure 9). This is due in part to the government’s ‘dispersal’ policy, which distributes the responsibility of hosting asylum-seekers away from London and the South East (Brokenshire, 2015 in Politowski and McGuinness, 2016; Bates, 2015).
Figure 9
Several factors complicate this trend. As asylum-seekers receive refugee status, they may move away from dispersal areas. For example, among all migrants who moved to the UK for asylum since 2000 (when the asylum dispersal system was operationalised under the Asylum Act 1999), more than one quarter were living in London by 2020 (APS, 2020).
More recent complicating factors include a change in the government’s dispersal policy, which has seen a slightly larger share of asylum seekers housed in London while their claims are pending (see the London Councils webpage on Asylum Seekers for more information). The longer periods asylum seekers typically spend in dispersal areas awaiting a decision on their claim (see the Migration Observatory briefing, Asylum and refugee resettlement in the UK), may also strengthen ties to the area and make plans to move to another place less attractive (Kearns and Whitley, 2015; Stewart and Shaffer, 2015: 37). The impact of these changes on the longer-term distribution of asylum-seekers and refugees across the UK is not yet clear, in part due to the effects of Covid-19 on the evidence base (as outlined in this briefing’s Understanding the Evidence section, above).
Evidence gaps and limitations
The analysis in this briefing has a number of limitations. Sample sizes and limitations in survey data (as explained in the Understanding the Evidence section above) mean that it is not always possible to identify statistically significant differences between migrants’ settlement patterns in different parts of the UK.
Second, the data do not show whether the migrant has always lived in their current region of residence since arrival. Therefore, one cannot tell whether the current region of residence of a migrant is the same as their region of destination or how long they lived in a region before moving to another one. This makes it difficult to construct a full picture of the dynamics of migrants’ internal migration within the UK.
The main variable used for the information on reasons for migration is self-reported. The alternative responses to choose from are not mutually exclusive as people’s decisions to migrate are multifaceted. While someone might cite family as their main reason for migration, their migration decisions may also be informed by the available opportunities to study or work.
Acknowledgements
Thanks to Ben Corr for comments on a previous draft of this briefing.
This briefing was produced with the support of Trust for London and the Paul Hamlyn Foundation. Trust for London is one of the largest independent charitable foundations in London and supports work which tackles poverty and inequality in the capital. The Paul Hamlyn Foundation is an independent funder working to help people overcome disadvantage and lack of opportunity, so that they can realise their potential and enjoy fulfilling and creative lives.
The use of the ONS statistical data in this briefing does not imply the endorsement of the ONS in relation to the interpretation or analysis of the statistical data. This briefing uses research datasets, which may not exactly reproduce National Statistics aggregates.
References
- Annual Population Survey (2020) Office for National Statistics. January to December 2020.
- Athow, J. (2021) Carry that weight: Reducing the effects of COVID-19 on the Labour Force Survey. ONS. Available online.
- Bates, M.W. (2015) Asylum: Question for Home Office. UK Parliament: Written answer, 11 December 2015. UIN HL4217. Available online.
- Kearns, A. & E. Whitley (2015) Getting There? The Effects of Functional Factors, Time and Place on the Social Integration of Migrants. Journal of Ethnic and Migration Studies, 41(13): 2105-2129. Available online.
- Stewart, E., & M. Shaffer (2015). Moving on? Dispersal policy, onward migration and integration of refugees in the UK. University of Strathclyde, Glasgow. Available online.
- ONS (2016) Labour Force Survey – user guidance. Volume 1: Background and Methodology.
- ONS (2020) Population of the UK by country of birth and nationality: individual country data. Available online.
- ONS (2021) Local area migration indicators, UK. Available online.
- Politowski, B. and T. McGuinness (2016) Policy on the dispersal of asylum seekers. House of Commons Library Research Briefing. Available online.
- Sumption, M. (2021) Where did all the migrants go? Migration data during the pandemic. Migration Observatory, COMPAS. Available online.
- Weeks, A., A. Fallows, P. Broad, S. Merad & K. Ashworth. No date. Non-response Weights for the UK Labour Force Survey? Results from the Census Non-response Link Study. ONS.